 Market Watch 20019: Beware of The Foreclosures
✉️ Want to forward this article? Click here.
New home for sale in Deanwood
Housing Market Watch is a weekly feature on UrbanTurf in which Keith Gibbons, the brains behind DCHousingPrices.com analyzes recent MRIS statistics for a specific DC area zip code to help paint a picture of the housing market in that area.
In Housing Market Watch this week, UrbanTurf looks at the DC zip code of 20019. 20019 is the easternmost zip code in DC, bounded on the northeast and southeast by the DC/Maryland border, to the west and northwest by the Anacostia River, and on the southwest by N Street and Massachusetts Avenue SE (roughly). Home to Fort Dupont Park, sections of the Benning Heights, Fort Dupont, Deanwood, Lincoln Heights, and Marshall Heights neighborhoods are located in this zip code.
In April, 33 residential properties sold in 20019. Here is a chart providing a year-over-year comparison of sales volume, median price and average price:
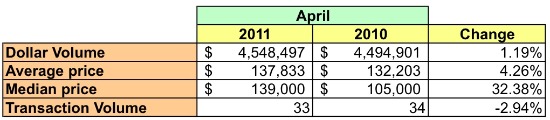
20019 Market Summary
There are two things worth noting about the 20019 zip code. First, the area is not one that has a lot of options for condo buyers. Thirty-three houses sold in April 2011 compared to 34 in April 2010, but no condos sold in either of those months. (Author’s note: This is the first time I’ve analyzed a DC zip code where not one condo was sold.)
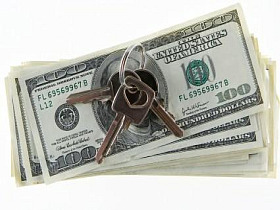
Second, the zip code has a very high rate of foreclosure, evidenced by recent sales statistics: of the 33 houses that sold in April, 16 were bank-owned. This has been the trend in 20019 for the last year, as foreclosures have accounted for anywhere between 30 and 50 percent of the homes sold in a given month. Prices have also been affected. In April, the median sales price of regular for-sale properties was $197,000, but for foreclosed properties, it was $75,450. The latter price has dragged down the median price for the area, making it 65.16 percent lower than the rest of the city.
Below are charts that provide more detailed statistics of the market in 20019.
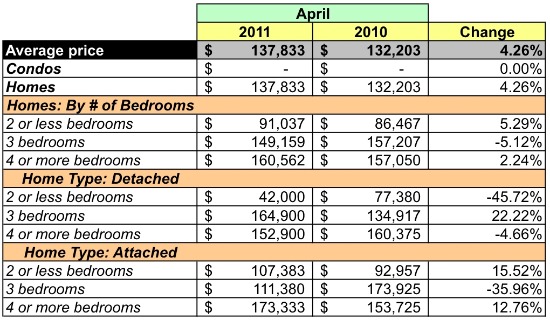
Average Sales Price
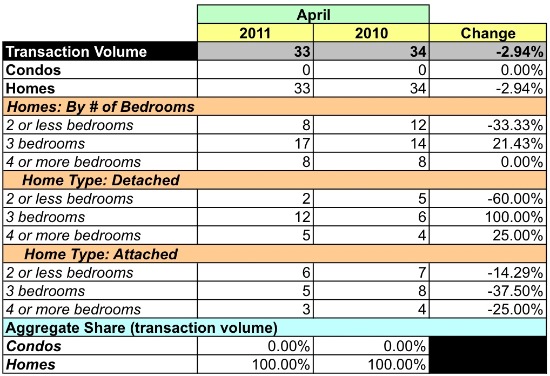
Unit Sales Volume
Similar Posts:
- Market Watch 20001: Shaw, LeDroit Park, Mount Vernon Square, Bloomingdale
- Market Watch 20036: Dupont Circle South
- Market Watch 20814: Downtown Bethesda

This article is based on custom data provided to UrbanTurf by MRIS, a developer of real estate technology and information as well as the largest multiple listing service (MLS) in the United States.
See other articles related to: 20019, dclofts, deanwood, market watch
This article originally published at https://dc.urbanturf.com/articles/blog/market_watch_20019_beware_of_the_foreclosures/3607.


UrbanTurf Listings showcases the DC metro area's best properties available for sale.

Most Popular... This Week • Last 30 Days • Ever

UrbanTurf is re-running its primer on property taxes which outlines a few things that... read »

The wait for Eataly in the DC area has been a long one.... read »
The Arlington County Board signed off on a pair of transformative residential project... read »

The plan to add a shade structure along the Cleveland Park commercial corridor has re... read »

DOGE doesn't seem dead yet; Monument buys Inn of Rosslyn; and Costco gas stations are... read »


DC Real Estate Guides
Short guides to navigating the DC-area real estate market
We've collected all our helpful guides for buying, selling and renting in and around Washington, DC in one place. Start browsing below!
First-Timer Primers
Intro guides for first-time home buyers
Unique Spaces
Awesome and unusual real estate from across the DC Metro