What's Hot: Cash Remained King In DC Housing Market In 2025 | 220-Unit Affordable Development Planned Near Shaw Metro
 Rising Prices, Multiple Bids: A Year in DC's Housing Market
✉️ Want to forward this article? Click here.
Rising prices, historically low inventory and multiple bids. The last year in the DC housing market has been an interesting one. To illustrate to readers the trajectory of the market between June 2012 and June 2013, we pulled out a few graphics.
Sold Listings
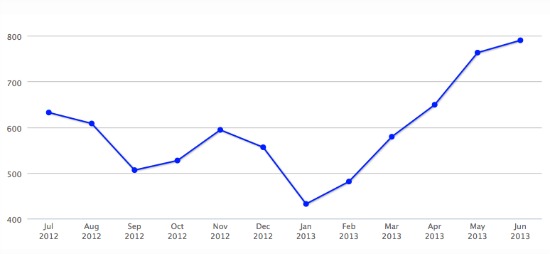
There were 790 closed sales in Washington, DC in June, a 12.5 percent increase over the 702 sales from last June. 809 contracts were signed in June versus 757 a year ago.
Median Sales Price
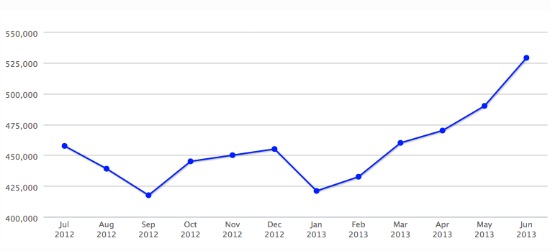
Home prices in the District of Columbia rose 16.3 percent between June 2012 and June 2013 to reach a median sales price of $529,000, the highest on record for the city. The new price point shatters the previous record, set in May 2013, by almost $40,000.
Average Days on Market
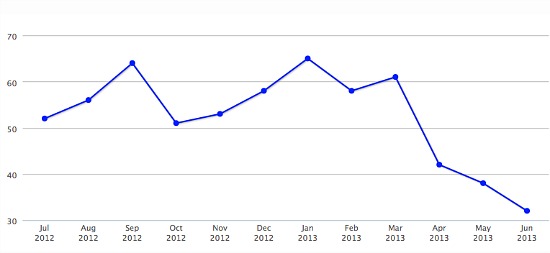
The average number of days that active listings spent on the market in DC last month was 32. To put that number in perspective, it is 38 percent less than last year when homes were taking on average 52 days to sell.
Average Sold To Original List Price Ratio
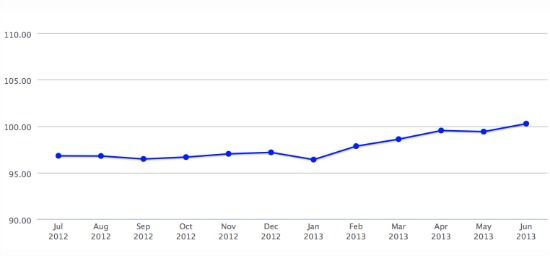
The average sale to original list price ratio for homes sold in DC exceeded 100 percent (100.26 percent) in June, which meant that on average, homes sold for above their list price last month. The ratio was 3 percent higher than June 2012.
See other articles related to: dc home and condo prices, dc home prices, dc housing inventory, dc housing prices, dclofts
This article originally published at https://dc.urbanturf.com/articles/blog/a_year_in_dcs_housing_market/7353.
Most Popular... This Week • Last 30 Days • Ever
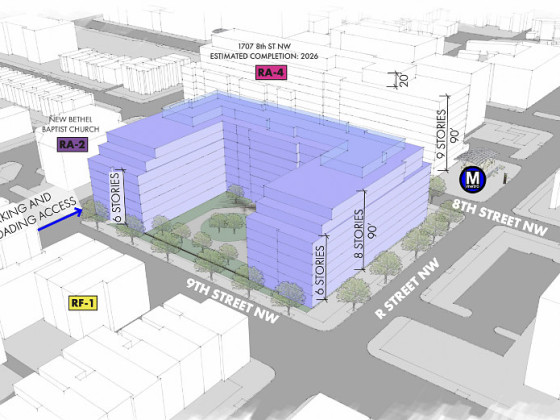
Lincoln-Westmoreland Housing is moving forward with plans to replace an aging Shaw af... read »
The small handful of projects in the pipeline are either moving full steam ahead, get... read »
A report out today finds early signs that the spring could be a busy market.... read »

A potential collapse on 14th Street; Zuckerberg pays big in Florida; and how the mark... read »

A potential innovation district in Arlington; an LA coffee chain to DC; and the end o... read »
DC Real Estate Guides
Short guides to navigating the DC-area real estate market
We've collected all our helpful guides for buying, selling and renting in and around Washington, DC in one place. Start browsing below!
First-Timer Primers
Intro guides for first-time home buyers
Unique Spaces
Awesome and unusual real estate from across the DC Metro
