What's Hot: Rising Costs Stall 434-Unit Takoma Metro Project | The DC-Area Luxury Market Is Playing By Its Own Rules
 6.4 Million Square Feet: The Most Interesting Statistics From DC’s Development Report
✉️ Want to forward this article? Click here.
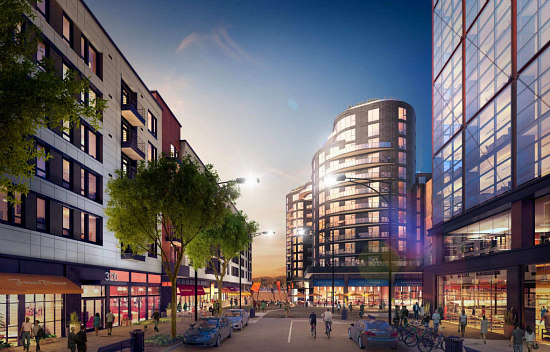
Rendering of a new mixed-use development planned near Union Market.
The Washington DC Economic Partnership is hosting its annual meeting today, so we decided to go through their annual report and pick out some of the most interesting statistics and highlights when it comes to development in the city.
Here is a quick rundown:
- DC has added 13,800 jobs since September 2015, a 1.8 percent increase for a total of 780,000 jobs.
- As of 2015, young professionals made up 36.9 percent of the city’s population. This segment of the population has risen 19 percent since 2010.
- 59 projects totaling 6.4 million square feet will deliver in DC this year.
- DC currently has 84 residential projects under construction that will deliver in the next three years, for a total of 11,241 units.
- 80 percent of the largest residential projects under construction in the city are in Ward 6.
- The most active developer in the city (not limited to residential development) is The JBG Cos. with 15 projects either under construction or in the pipeline. Douglas Development comes in second with 13 projects.
- The most active architect is Shalom Baranes with 21 projects in the works.
- Nearly 90 percent of the 14,847 residential units under construction in DC will be rental apartments.
- In the 12 months ending September 2016, the city has issued 5,129 housing permits, up 24.1% from a year ago.
- The Foggy Bottom sub-market had DC’s highest effective rental rate for apartments in the third quarter of 2016 at $2,672/month. Anacostia had the lowest at $1,621/month.
- In the Union Market/NoMA sub-market, there are 15.6 million square feet of development under construction or in the pipeline, including approximately 11,400 residential units and 4.6 million square feet of office space.
- The average size of a one-bedroom in the early 2000s was 850 square feet. That has dropped to 725 to 750 square feet today.
story continues below
loading...story continues above
For the full report, click here. For more on the residential development on tap for DC and the region, check out UrbanTurf’s Pipeline.
This article originally published at https://dc.urbanturf.com/articles/blog/the_most_interesting_statistics_from_dcs_development_report/11900.


UrbanTurf Listings showcases the DC metro area's best properties available for sale.

Most Popular... This Week • Last 30 Days • Ever

The wait for Eataly in the DC area has been a long one.... read »
EYA and the Washington Metropolitan Area Transit Authority have requested a two-year ... read »

While the broader DC-area housing market grapples with elevated mortgage rates and ca... read »
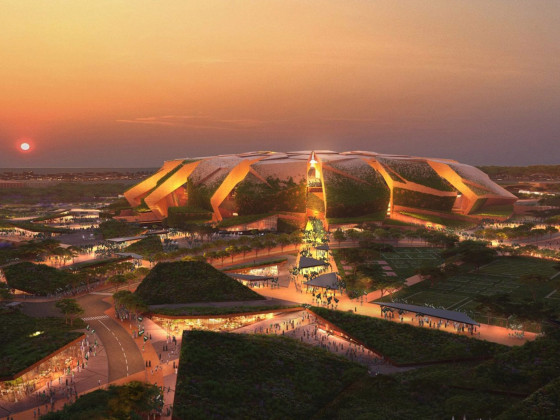
Justice Roberts selling Maryland home; bathroom danger; and what will future stadiums... read »
From the Maryland line down to the edge of downtown, a mix of office conversions, inf... read »


DC Real Estate Guides
Short guides to navigating the DC-area real estate market
We've collected all our helpful guides for buying, selling and renting in and around Washington, DC in one place. Start browsing below!
First-Timer Primers
Intro guides for first-time home buyers
Unique Spaces
Awesome and unusual real estate from across the DC Metro