What's Hot: 142-Unit Development At Inn of Rosslyn Site Moves Forward | Mortgage Rates Inch Closer To 7%
 The DC Neighborhoods Where White Homebuyers' Income is Double That of Existing Residents
✉️ Want to forward this article? Click here.
Earlier this month, UrbanTurf reported on a study which examined how DC and its neighborhoods changed demographically since 2000. Now, a new analysis has joined the fray, offering a more detailed look at how new homebuyers since 2012 have diversified the neighborhoods they buy into.
A recent article by the New York Times examines how the longtime narrative of households of color traditionally moving into and diversifying predominately white neighborhoods has shifted dramatically in the last two decades, as white households have moved in droves to nonwhite neighborhoods.
"Since 2000, according to an analysis of demographic and housing data, the arrival of white residents is now changing nonwhite communities in cities of all sizes, affecting about one in six predominantly African-American census tracts," the article states.
The article also notes that homebuyers of color tend to have incomes comparable to those of the households in the predominately white neighborhoods they move into, while white homebuyers' incomes tend to greatly exceed the existing households in nonwhite neighborhoods where they buy.
story continues below
loading...story continues above
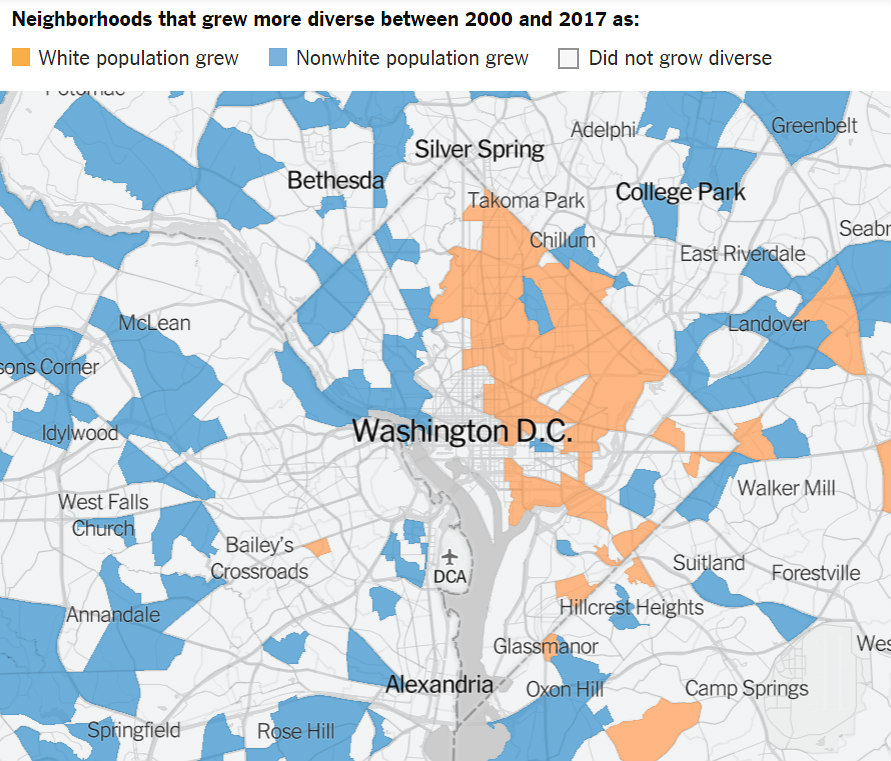
Washington, DC experienced this dynamic to varying extents. Here are some of the noteworthy data points UrbanTurf found using the Times' city-specific data:
- While there are several census tracts west of Rock Creek Park which diversified due to an influx of nonwhite residents, the average income of these new buyers tends to be comparable to that of the existing residents and homeowners, occasionally exceeding existing incomes very marginally.
- There are only two census tracts east of Rock Creek Park and north of East Capitol Street which diversified due to an increase in nonwhite homebuyers:
- In 2012, 77 percent of the population was nonwhite between Gallatin Street and Michigan Avenue NE, from North Capitol Street to the railroad tracks, and from 2012-2017, 60 percent of mortgage loans there were made to nonwhite buyers. These new nonwhite buyers had incomes exceeding those of existing homeowners in the area, with a $99,000 average income from 2012-2017 compared to $73,000 among existing homeowners in 2012.
- The other Northeast census tract which diversified due to nonwhite residents is between Massachusetts Avenue and East Capitol Street, between 1st and 8th Streets NE. Here, 18 percent of the 2012 population was nonwhite, while 38 percent of mortgage loans here from 2012-2017 went to nonwhite buyers. Nonwhite buyers here also out-earned existing homeowners, earning $225,000 on average from 2012-2017 compared to a $196,000 average homeowner income in 2012.
- There were several census tracts where the average income of white homebuyers from 2012-2017 was nearly or more than double the average income of existing residents.
- Perhaps the most drastic example of this is in the Buzzard Point census tract southwest of South Capitol and M Streets SW, roughly bound by 3rd Street to the west. White people represented 4 percent of the 2012 population and 53 percent of mortgage loans from 2012-2017. Compared to an average household income of $30,000 ($58,000 among homeowners) in 2012, white homebuyers earned an average of $191,000.
- In the Michigan Park census tract from Sargent Road to 18th Street between Eastern Avenue and Otis Street NE, white people represented 16 percent of the 2012 population and 45 percent of mortgage loans from 2012-2017. Compared to an average household income of $81,000 ($83,000 among homeowners) in 2012, white homebuyers earned an average of $165,000.
- In the Shaw census tract from O to S Street between 7th and 11th Streets NW, white people represented 32 percent of the 2012 population and 64 percent of all mortgage loans from 2012-2017. Compared to an average household income of $86,000 ($148,000 among homeowners) in 2012, white homebuyers earned an average of $207,000.
- In the Trinidad census tract from West Virginia Avenue to Bladensburg Road, between Queen Street NE and Montana Avenue, white people represented 4 percent of the 2012 population and 39 percent of mortgage loans from 2012-2017. Compared to an average household income of $51,000 ($91,000 among homeowners) in 2012, white homebuyers earned an average of $116,000.
- In Fort Lincoln, white people represented 2 percent of the 2012 population and 20 percent of mortgage loans from 2012-2017. Compared to an average household income of $57,000 ($106,000 among homeowners) in 2012, white homebuyers earned an average of $136,000.
- In the Carver-Langston census tract east of the Starburst intersection between Bladensburg Road and Maryland Avenue NE, white people represented 5 percent of the 2012 population and 48 percent of mortgage loans from 2012-2017. Compared to an average household income of $48,000 ($76,000 among homeowners) in 2012, white homebuyers earned an average of $106,000. In the tract immediately south, bounded by Benning Road, white people represented 4 percent of the 2012 population and 39 percent of mortgage loans from 2012-2017, earning an average of $101,000 compared to existing household income of $44,000 (no 2012 homeowner income data was available here).
- In the Anacostia census tract north of Good Hope Road SE, bound by Naylor Road and S Street, white people represented 1 percent of the 2012 population and 30 percent of mortgage loans from 2012-2017. Compared to an average household income of $55,000 ($81,000 among homeowners) in 2012, white homebuyers earned an average of $109,000.
- In the Congress Heights census tract from Wheeler to Stanton Road between Alabama and Southern Avenues SE, white people represented 3 percent of the 2012 population and 16 percent of mortgage loans from 2012-2017. Compared to an average household income of $48,000 ($91,000 among homeowners) in 2012, white homebuyers earned an average of $150,000.
The Times's data is from the Census Bureau and the Home Mortgage Disclosure Act, and all white households are non-Hispanic. It should also be noted that the data does not account for all-cash home purchases and that median income is generally a more reliable measure of income than averages.
See other articles related to: displacement, diversification, gentrification, income, mortgage lending, the new york times
This article originally published at https://dc.urbanturf.com/articles/blog/the-dc-neighborhoods-where-white-homebuyers-income-was-double-existing-resi/15323.
Most Popular... This Week • Last 30 Days • Ever
Buffett called the five-bedroom listing home when his father, Howard Buffett, was ser... read »

Estate taxes, also known as inheritance taxes or death duties, are taxes imposed on t... read »
The application may signal movement on the massive mixed-use project.... read »

Penzance has unveiled its striking new plans for Rosslyn.... read »
A new report finds that the current housing market is split into two groups.... read »
- The Oracle of Spring Valley: Warren Buffett's Childhood Home in DC Hits the Market
- What Are Estate Taxes and How Do They Work?
- Raze Application Filed For Site Of 900-Unit Development, Food Hall Along Anacostia River
- Three Buildings, 862 Units: The New Plans For Rosslyn's Skyline
- The Two Housing Markets
DC Real Estate Guides
Short guides to navigating the DC-area real estate market
We've collected all our helpful guides for buying, selling and renting in and around Washington, DC in one place. Start browsing below!
First-Timer Primers
Intro guides for first-time home buyers
Unique Spaces
Awesome and unusual real estate from across the DC Metro


