 The 3 Most Important Charts For the DC-Area Housing Market in the Coming Months
✉️ Want to forward this article? Click here.

Today, UrbanTurf is taking a look at what we think will be the three metrics that will determine the direction of the DC-area market in the coming months.
.png)
The main theme of the market in the coming year will be something that homebuyers are all too familiar with: a dearth of homes for sale. In late 2020, there was about a 1.5-month supply of homes for sale in the DC region, historically one of the lowest inventories on record. December 2021 looked at that number and said hold my beer, as data last week revealed that the housing supply fell to its lowest level in 20 years last month. More homes will hit the market as spring approaches, but the influx likely won't be enough to satisfy homebuyers on the hunt.
story continues below
loading...story continues above
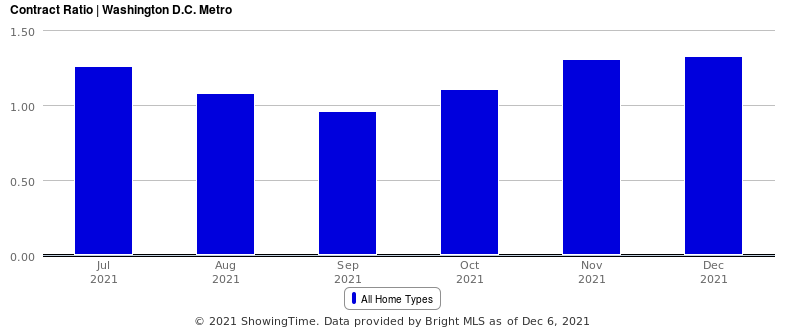
Contract ratio may be the most important metric to watch over the coming months, particularly if inventory remains low. This statistic compares the total number of homes under contract in a given period to the overall number of active listings, making it a good marker for the level of competition in the market. A higher ratio signifies an increase in contracts compared to supply. For example, a ratio of 1.2 means there are 1.2 listings under contract for every listing that is active.
For the last three months of 2021, the contract ratio in the DC area was above 1.0. and rose each month. If it stays in this range or rises as spring approaches, it means competition in the market in increasing. And that competition is already intense: in the last week, UrbanTurf has heard of two listings getting upwards of 20 offers each.
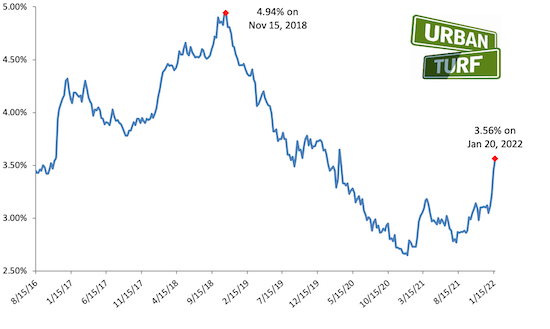
The one thing that might give buyers hesitation this spring is laid out in the chart above. Today, long-term interest rates rose to 3.56 percent, a 51 basis point increase since the beginning of the year and the highest that rates have been since early 2020. While still quite low by historic standards, buyers in recent years have grown accustom to rates hovering around 3 percent or lower. It will be interesting to see how the buying public react to these rising rates in the coming months.
Data provided by Bright MLS. Photo courtesy of HomeVisit.
See other articles related to: contract ratio, dc area housing market, dc area housing supply, dc area market trends, dc housing inventory, interest rates, mortgage rates
This article originally published at https://dc.urbanturf.com/articles/blog/the-3-most-important-charts-for-the-dc-area-housing-market-in-the-coming-mo/19161.


UrbanTurf Listings showcases the DC metro area's best properties available for sale.

Most Popular... This Week • Last 30 Days • Ever

EYA and the Washington Metropolitan Area Transit Authority have requested a two-year ... read »

While the broader DC-area housing market grapples with elevated mortgage rates and ca... read »

From the Maryland line down to the edge of downtown, a mix of office conversions, inf... read »

Close-in suburbs are seeing some of the steepest rent declines in the region, while s... read »

Bloomberg reported this week that Apple is preparing its biggest-ever push into the s... read »


- Rising Costs Stall 434-Unit Takoma Metro Project, Developer Seeks More Time
- The DC-Area Luxury Market Is Playing By Its Own Rules
- 1,800 Units In The Works: Connecticut Avenue's Building Boom
- Across The DC Region, Rent Growth Is Splitting Along The Beltway
- Apple Is Building a Control Panel for Your Home
DC Real Estate Guides
Short guides to navigating the DC-area real estate market
We've collected all our helpful guides for buying, selling and renting in and around Washington, DC in one place. Start browsing below!
First-Timer Primers
Intro guides for first-time home buyers
Unique Spaces
Awesome and unusual real estate from across the DC Metro