 The 3 Charts That Will Define the Spring Housing Market
✉️ Want to forward this article? Click here.

With spring officially here, the busy season has officially begun for buying and selling homes. With that in mind, UrbanTurf looked at what we think will be the three metrics that will define the DC-area market in the coming months.
Not much will likely change in the coming months for what has been the biggest story in the local real estate market: the severe shortage of homes for sale. Consider the trajectory of housing supply over the last 24 months: two years ago there was a two-month supply, which then dropped to about a month in 2020. The supply fell below the one-month level in January for the first time and could stay around that level into spring. For context, the benchmark for a balanced housing supply is six months, a level that the region hasn't seen in years.
story continues below
loading...story continues above
Contract ratio compares the total number of homes under contract in a given period to the overall number of active listings, making it a good marker for the level of competition. For years, the contract ratio in the DC area rarely rose higher than 1.0, but for the last 12 months, it has regularly been at or above that level. In February, it hit 1.40, its highest level on record. If it stays in this range, it points to a very competitive market in the coming months for buyers. And that competition is already being seen in the market: in the last week, UrbanTurf has heard of three listings getting upwards of 25 offers each.

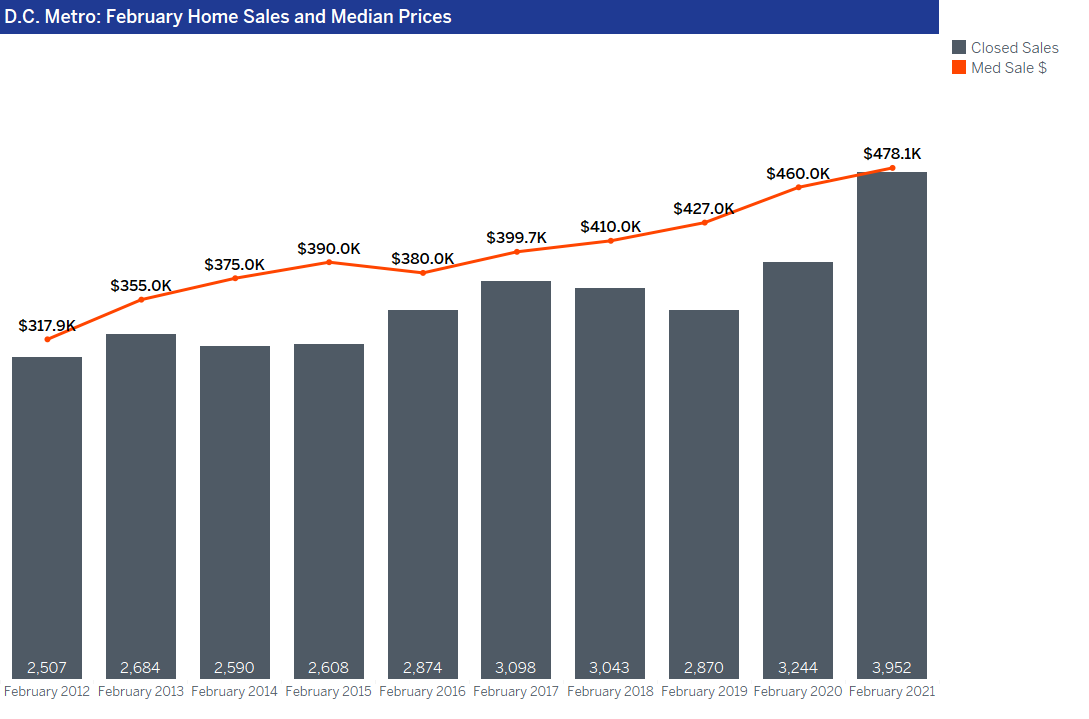
Two things happened in the February housing market that could give a sense of what will happen this spring. Home prices were at or near their highest level on record for the month, but so were sales. In other words, rising prices did nothing to dampen buyer interest. The path of interest rates in the coming weeks will likely have an effect on buyer demand in the region; if they don't shoot up, that demand will likely remain high.
Photo courtesy of TruPlace.
See other articles related to: dc area housing market, dc housing market
This article originally published at https://dc.urbanturf.com/articles/blog/the-3-charts-that-will-define-the-spring-housing-market/18044.
Most Popular... This Week • Last 30 Days • Ever

The differences between condo fees and co-op fees might seem small, but there are som... read »

As mortgage rates have more than doubled from their historic lows over the last coupl... read »

International migration was the driving force behind the rise in DC's population.... read »

A report out today stated that there were nearly 3,900 home sales last month, a 26% y... read »

Last week, President Biden signed a bill into law that transfers the land that includ... read »
DC Real Estate Guides
Short guides to navigating the DC-area real estate market
We've collected all our helpful guides for buying, selling and renting in and around Washington, DC in one place. Start browsing below!
First-Timer Primers
Intro guides for first-time home buyers
Unique Spaces
Awesome and unusual real estate from across the DC Metro


