 Housing Market Watch: 20002
✉️ Want to forward this article? Click here.
Housing Market Watch is a weekly feature on UrbanTurf in which Keith Gibbons, the brains behind DCHousingPrices.com analyzes recent MRIS statistics for a specific DC zip code to help paint a picture of the housing market in that area.
In Housing Market Watch this week, UrbanTurf takes a look at recently-released home sales statistics for the 20002 zip code.
20002 is roughly bordered by East Capitol Street on the south; North Capitol Street on the west; the Anacostia River on the east; and New York Avenue and Michigan Ave on the north. Portions of a variety of neighborhoods are encompassed within those borders including Capitol Hill, Edgewood, Eckington, and Trinidad. The H Street Corridor is also part of this zip code, so there are likely a number of current residents, wanna-be residents, and developers who are interested in how the market is performing.
Forty-five units sold in 20002 in January and here is a chart providing a year-over-year comparison of sales volume, median price and average price:
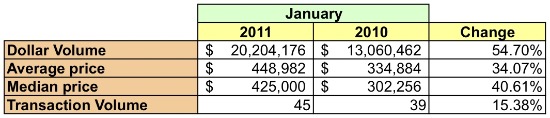
20002 Market Summary
- Almost across the board, January 2011 was a much better month for the market in 20002 than a year ago. Aggregate dollar volume rose 54.7 percent and the number of units sold increased 15.38 percent. The average sales price was up a healthy 34.07 percent and the median sales price increased 40.61 percent.
- Condos are a mere blip on the 20002 housing radar. In January, they accounted for just four of the 45 units sold, translating into a little more than four percent of the dollar volume. The number of condos sold in January 2011 was about half that of January 2010.
- Three-bedroom single-family homes dominated the market, representing slightly more than half of all homes sold in the zip code. Dollar volume almost doubled year-over-year, up 81.02 percent. Sales for this property type were up 32.26 percent percent and the average price rose 36.87 percent.
- A few other interesting takeaways: 1) No condo sold for more than $400,000 in January and only one home sold over $1 million and 2) There is a 14.3-month’s supply of condos on the market and a 3.44-month’s supply of single-family homes.
In January, 20002 represented just under 12 percent of unit sales in DC, a similar percentage to that of 20009, which we featured last week. In comparison to the rest of the city, the average median price was 11.99 percent higher in January. Overall, sales activity (i.e., contracts closed, homes under contract, and homes with contingent contracts) was not significantly different from that of January 2010, except that the number of contingent contracts was much higher last month: 57 versus 37.
In conclusion, attached homes (e.g. row houses) dominated sales last month and have experienced huge increases in dollar volume and average sales prices — prices for two-bedroom and four-bedroom homes have increased more than 100 percent since January 2010. That being the case, anyone thinking of buying in 20002 should understand that with houses selling fast and prices increasing, they will also have to move quickly when they find the right home.
Below are charts that provide more detailed statistics of the market in 20002.
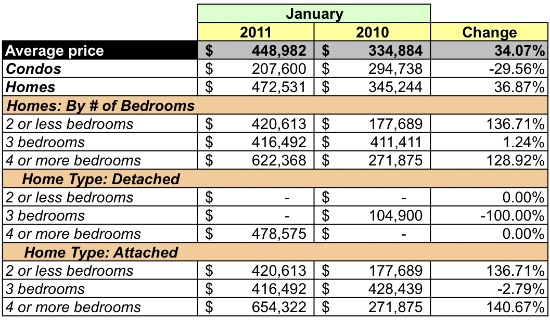
Average Price
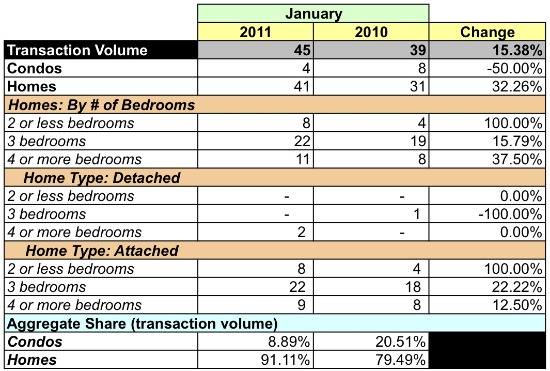
Unit Sales Volume
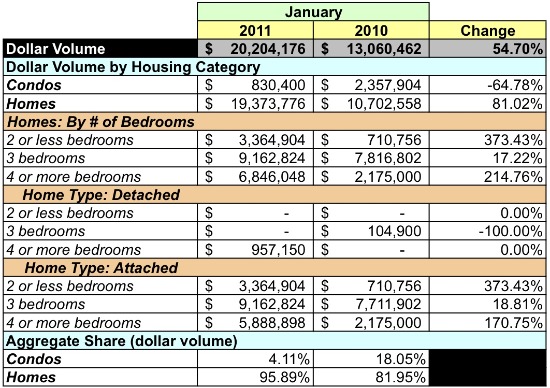
Dollar Volume
Next Week: A report on the 20015 zip code.
Similar Posts:
See other articles related to: 20002, dclofts, market watch
This article originally published at https://dc.urbanturf.com/articles/blog/housing_market_watch_20002/3070.


UrbanTurf Listings showcases the DC metro area's best properties available for sale.

Most Popular... This Week • Last 30 Days • Ever

UrbanTurf is re-running its primer on property taxes which outlines a few things that... read »

The wait for Eataly in the DC area has been a long one.... read »
The Arlington County Board signed off on a pair of transformative residential project... read »
The plan to add a shade structure along the Cleveland Park commercial corridor has re... read »

DOGE doesn't seem dead yet; Monument buys Inn of Rosslyn; and Costco gas stations are... read »


DC Real Estate Guides
Short guides to navigating the DC-area real estate market
We've collected all our helpful guides for buying, selling and renting in and around Washington, DC in one place. Start browsing below!
First-Timer Primers
Intro guides for first-time home buyers
Unique Spaces
Awesome and unusual real estate from across the DC Metro