 Home Price Watch: Capitol Hill
✉️ Want to forward this article? Click here.
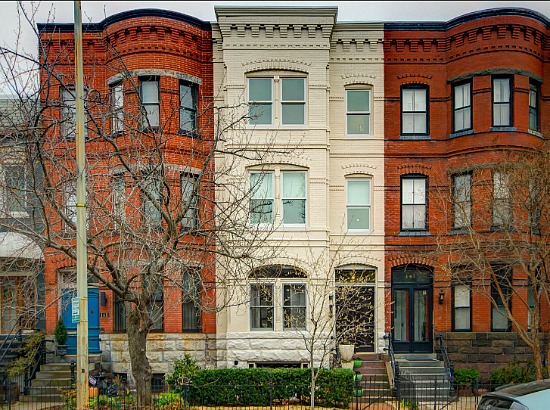
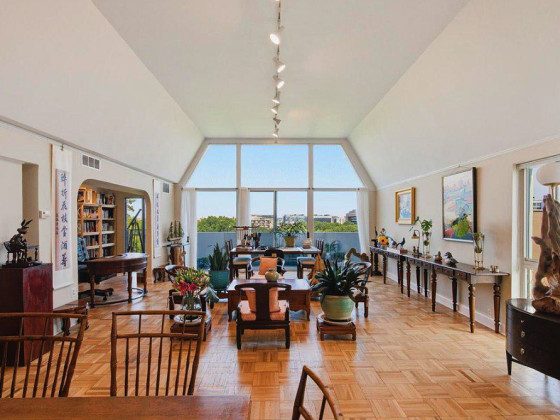
Home for sale on 11th Street NE
For years, UrbanTurf has been hoping that RealEstate Business Intelligence (RBI) would figure out a way to start providing housing statistics not just for zip codes in the DC region, but also specific neighborhoods as well.
Well, recently the folks over at RBI started offering that option to some of its customers. Specifically, housing statistics for over 7,000 legal and advertised subdivisions (neighborhoods) around the region are now available. (Any subdivision that averages at least six sales a year is included.)
UrbanTurf gave the new feature a bit of a test drive this week by looking at 2014 statistics in the advertised subdivision for Capitol Hill. Below is a chart with Capitol Hill housing data followed by some interesting highlights that we picked out based on the stats. Our plan is to get a little more in-depth every week with each neighborhood we analyze.
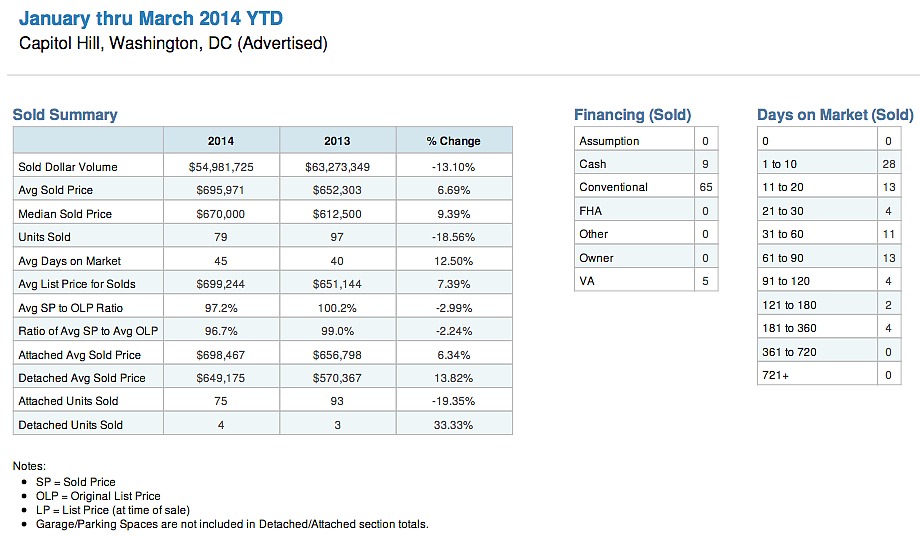
- While sales volume dipped by about 13 percent so far this year, the average and median sales prices rose on Capitol Hill when compared to 2013. The average sold price increased 6.7 percent ($695,971) and the average median price rose 9.4 percent ($670,00).
- Home sellers believe that they can get more this year, as evidenced by the increase in average list price, from $651,144 last year to $699,244 this year.
- The average sales price to original list price ratio has dropped off between 2013 and 2014. Last year at this time it was just over 100%, a sign that homes were regularly selling for over their asking price. This year, that percentage stands at about 97.
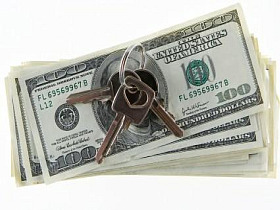
- Of the 79 units sold so far this year, nine were purchased in all-cash transactions.
See other articles related to: capitol hill, capitol hill housing statistics, dclofts
This article originally published at https://dc.urbanturf.com/articles/blog/home_price_watch_capitol_hill/8365.


UrbanTurf Listings showcases the DC metro area's best properties available for sale.

Most Popular... This Week • Last 30 Days • Ever

When you buy a home in the District, you will have to pay property taxes along with y... read »
This is one of the more intriguing adaptive reuse proposals of the year.... read »
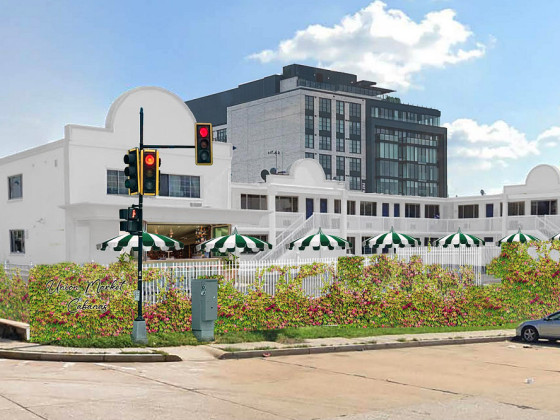
The developer wants to transform the 1960s motor lodge into "Union Market Cabanas" �... read »
This week we bring back What X Buys You as UrbanTurf takes a look at how far an $850,... read »
The final phases of one of Northeast DC's largest developments are going to need a li... read »


- First-Timer Primer: Tax Relief for DC Homeowners
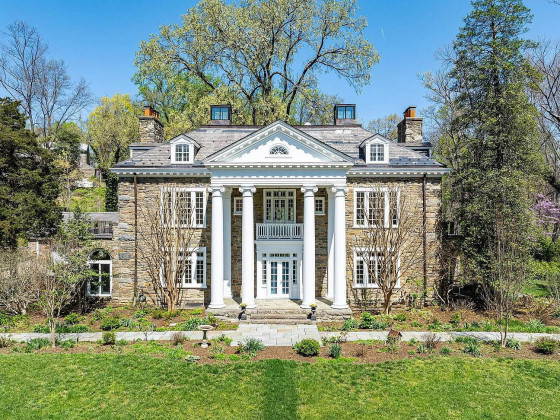
- The Plan To Turn A Rock Creek Park Estate Into A Suburban-Style Pool and Tennis Club
- From Motel 6 to "Union Market Cabanas": Interim Plans Filed for Union Market Site
- How Far $850,000 Goes In The DC-Area Housing Market
- Restaurants, Recreation Venue in the Works as Art Place Seeks More Time for Final Phases
DC Real Estate Guides
Short guides to navigating the DC-area real estate market
We've collected all our helpful guides for buying, selling and renting in and around Washington, DC in one place. Start browsing below!
First-Timer Primers
Intro guides for first-time home buyers
Unique Spaces
Awesome and unusual real estate from across the DC Metro