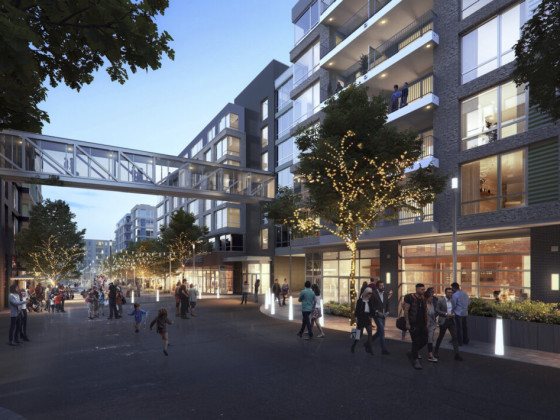
What's Hot: 1,080 Homes, a Costco and a New Neighborhood: An Early Look at Viva White Oak's First Phase
 DC's Racial Divide, Circa 2000
✉️ Want to forward this article? Click here.
DCist has featured a fascinating map of the ethnic breakdown of the DC metropolitan area, based on data from the 2000 Census. The colored dots on the map below, created by Eric Fischer, correspond to 25-person groups of specific ethnicities (red represents White, blue represents Black, green represents Asian, orange represents Hispanic).
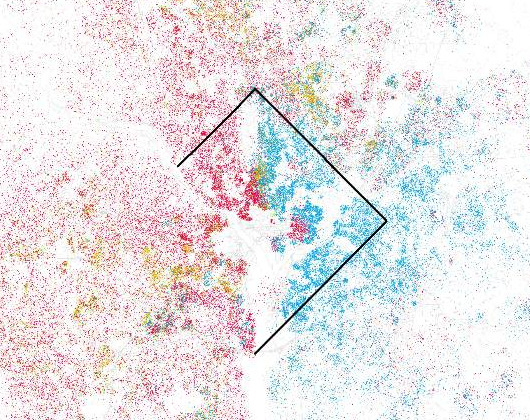
The racial divide illustrated by the map is extremely noticeable, with red dots dominating much of Northwest and blue dots filling Northeast and Wards 7 and 8. The white section near the top of the map that is Rock Creek Park shows how much of a dividing line the park was between white and black communities in 2000. Also, it is interesting to get a bird’s eye view of Capitol Hill (that little pocket of red toward the lower right corner of the map).
Hopefully Fischer will create similar maps once the 2010 Census data is released, as it will be interesting to see how things have changed during the past ten years.
This article originally published at https://dc.urbanturf.com/articles/blog/dcs_racial_divide_circa_2000/2492.


UrbanTurf Listings showcases the DC metro area's best properties available for sale.

Most Popular... This Week • Last 30 Days • Ever

When you buy a home in the District, you will have to pay property taxes along with y... read »

The first residential piece of one of Montgomery County's largest developments is com... read »
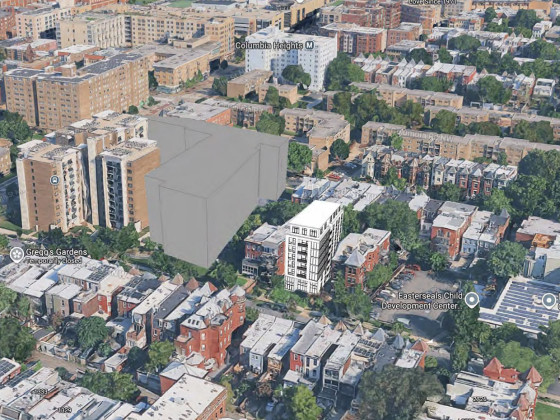
A Columbia Heights lot that has sat empty for more than a decade could soon be home t... read »
The final phases of one of Northeast DC's largest developments are going to need a li... read »

Sellers asking for AI stock instead of cash, Nvidia lands downtown, and a closer look... read »


- First-Timer Primer: Tax Relief for DC Homeowners
- 1,080 Homes, a Costco and a New Neighborhood: An Early Look at Viva White Oak's First Phase
- 30-Unit Building Proposed For Long-Vacant Columbia Heights Lot
- Restaurants, Recreation Venue in the Works as Art Place Seeks More Time for Final Phases
- Friday's Must Reads
DC Real Estate Guides
Short guides to navigating the DC-area real estate market
We've collected all our helpful guides for buying, selling and renting in and around Washington, DC in one place. Start browsing below!
First-Timer Primers
Intro guides for first-time home buyers
Unique Spaces
Awesome and unusual real estate from across the DC Metro