 DC Home Prices Rise in May as Inventory Dwindles
✉️ Want to forward this article? Click here.
For the second month in a row, home prices in the DC area rose significantly as the inventory of homes for sale continued to shrink.
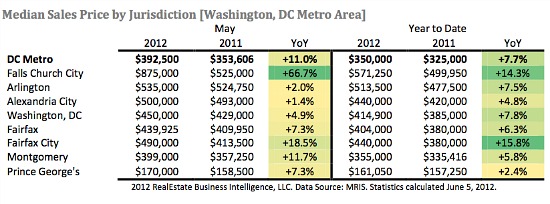
A report from RealEstate Business Intelligence (RBI) released today revealed that the median home price for the region in May was $392,500, 11 percent higher than May 2011 (and approximately $20,000 higher than the median price from last month). This gain follows an 11.2 percent rise in home prices between April 2011 and April 2012, and marks the fourth consecutive month of annual increases for the region. In DC proper, prices rose 4.9 percent, from $429,000 to $450,000.
However, a shrinking inventory of homes for sale is part of the reason that prices are faring so well, RBI revealed:
There were 10,510 active listings in the DC area at the end of May, a 32.4 percent decline from May 2011. This is the 15th consecutive year-over-year inventory decline. The shrinking supply indicates a stabilizing market, as sales have increased and listings have declined. As interest rates remain low and demand rises, the low supply will continue to put upward pressure on prices. In May, 6,084 new listings entered the market, which is 6.7 percent below the previous year and the 11th year-over-year decline in new listings in the past twelve months.
As the number of “normal” homes for sale declines, so does the number of distressed properties. The report stated that active foreclosure listings are down 69.5 percent year-over-year, and that at 15.8 percent, “the proportion of active listings that are classified as distressed properties is at its lowest level since MRIS began tracking them in April 2009.”
The area that RBI analyzes includes DC, Montgomery County, Prince George’s County, Alexandria City, Arlington County, Fairfax County, Fairfax City, and Falls Church City. For more granular statistics of specific zip codes or areas, click here.
**Home pictured in thumbnail is for sale at 819 Q Street NW.
Similar Posts:
See other articles related to: dc home prices, dclofts, home prices, home values, mris, realestate business intelligence
This article originally published at https://dc.urbanturf.com/articles/blog/dc_home_prices_rise_11_percent_in_may/5638.


UrbanTurf Listings showcases the DC metro area's best properties available for sale.

Most Popular... This Week • Last 30 Days • Ever

When you buy a home in the District, you will have to pay property taxes along with y... read »
The final phases of one of Northeast DC's largest developments are going to need a li... read »
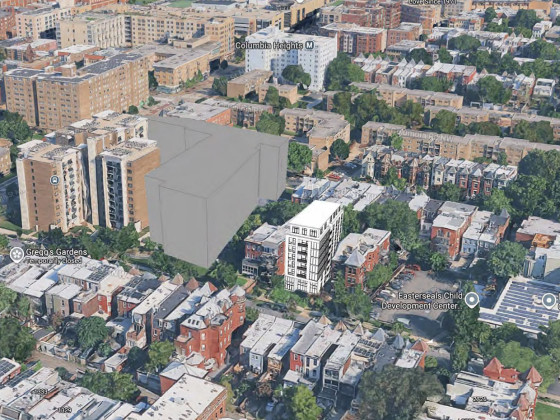
A Columbia Heights lot that has sat empty for more than a decade could soon be home t... read »

Sellers asking for AI stock instead of cash, Nvidia lands downtown, and a closer look... read »

Slow the Fast down; the slow Red Line summer; and why vintage IKEA is so hot.... read »


DC Real Estate Guides
Short guides to navigating the DC-area real estate market
We've collected all our helpful guides for buying, selling and renting in and around Washington, DC in one place. Start browsing below!
First-Timer Primers
Intro guides for first-time home buyers
Unique Spaces
Awesome and unusual real estate from across the DC Metro