What's Hot: Did January Mark The Bottom For The DC-Area Housing Market? | The Roller Coaster Development Scene In Tenleytown and AU Park
 A Quick History of Mortgage Rates
✉️ Want to forward this article? Click here.
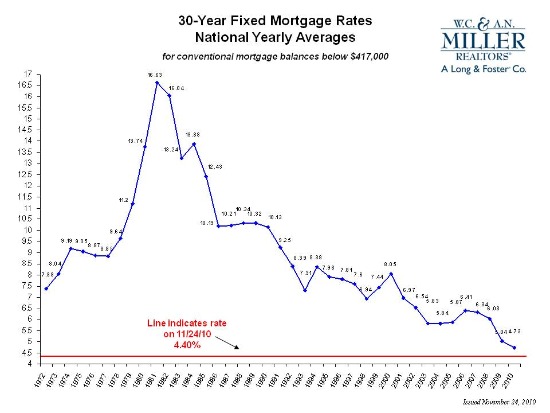
Long-term mortgage rates have hovered in the 4 to 6 percent range for so long that many modern-era homebuyers probably do not realize that rates used to be double, even triple what they are today.
When rates first started being tracked in the early 1970s, 7 percent was the norm for a few years before a spike to around 9 percent in 1975. Rates really started moving upward in the late 1970s, hitting 10 percent toward the end of the decade and as high as 18 and 19 percent in the early 1980s. That painful rate lasted only a few years before heading back down into the 7 to 9 percent range for much of the early 1990s.
It wasn’t until 2000-2001 that rates sunk below 7 percent and kept heading south until about 2006 when they rose a little bit and then started dropping again. The drop in rates during the 2000s coincided with rising property prices, so while rates were increasingly attractive, buyers were borrowing to pay for more expensive homes. It wasn’t until the last couple years that rates sunk into the 4 to 5 percent range.
We noted in a previous post that rates seem like they have been setting a record on an almost weekly basis over the last few months. While that is not the case exactly, rates have been dropping very consistently (except for a slight jump here and there) over the last year and a half. Here is a quick timeline for reference:
- June 12, 2009 – 5.65%
- August 3, 2009 – 5.25%
- October 14, 2009 – 4.87%
- December 9, 2009 – 4.71%
- July 29, 2010 – 4.54%
- October 7, 2010 – 4.27%
- November 11, 2010 — 4.17%
Rates are back up to 4.46 percent this week, the third week in a row that rates have increased.
This article originally published at https://dc.urbanturf.com/articles/blog/a_quick_history_of_mortgage_rates/2741.
Most Popular... This Week • Last 30 Days • Ever
As mortgage rates have more than doubled from their historic lows over the last coupl... read »
Lincoln-Westmoreland Housing is moving forward with plans to replace an aging Shaw af... read »

The small handful of projects in the pipeline are either moving full steam ahead, get... read »
The longtime political strategist and pollster who has advised everyone from Presiden... read »
A report out today finds early signs that the spring could be a busy market.... read »
DC Real Estate Guides
Short guides to navigating the DC-area real estate market
We've collected all our helpful guides for buying, selling and renting in and around Washington, DC in one place. Start browsing below!
First-Timer Primers
Intro guides for first-time home buyers
Unique Spaces
Awesome and unusual real estate from across the DC Metro
