What's Hot: Rising Costs Stall 434-Unit Takoma Metro Project | The DC-Area Luxury Market Is Playing By Its Own Rules
 What a New Report Says About the State of the U.S. Rental Market
✉️ Want to forward this article? Click here.
The latest Rental Housing report from Harvard University's Joint Center for Housing Studies released today offers interesting insights about the rental market over the past decade.
Below, UrbanTurf highlights some of the more interesting statistics for the national and local markets.
- 14.9% — The share of DC renter households that were behind on rent in the third quarter of 2021; 16.2% of renter households had lost income in the prior four weeks.
- 13.9% — The share of DC apartments renting for less than $600 a month in 2019. The number and share of apartments in this rent range have gone up since 2017, when they bottomed out.
story continues below
loading...story continues above
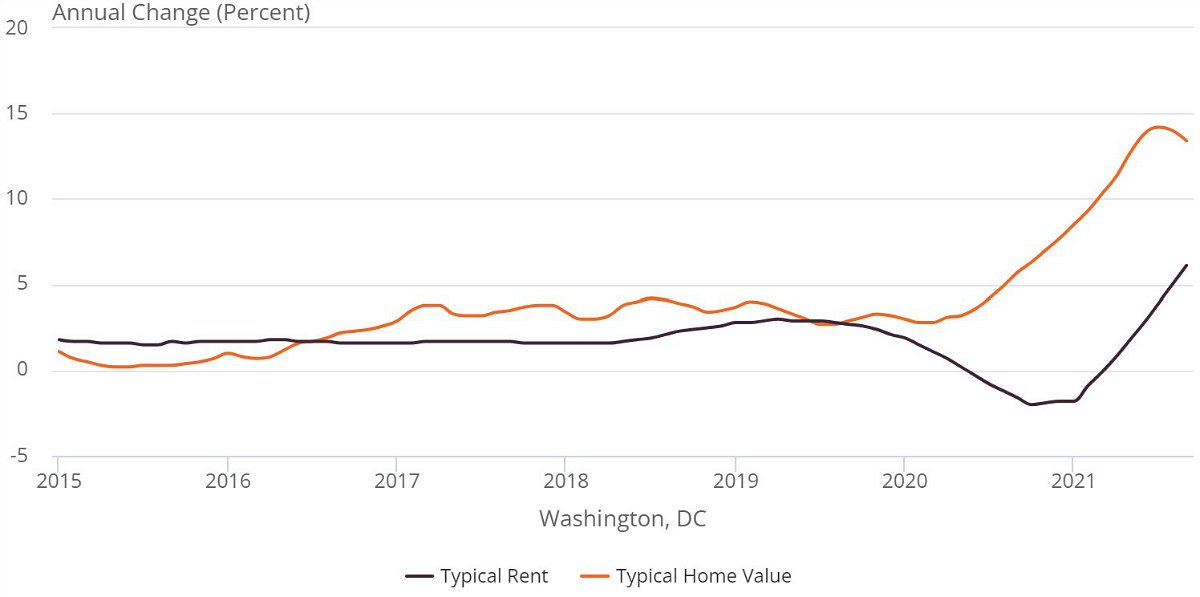
- 6.1% — The year-over-year change in typical rent in the DC area, as of September 2021.
- 13.4% — The year-over-year change in typical home values in the DC area, as of September 2021.
- $2,093 — The typical DC metro area rent in September 2021, up from $1,973 in September 2020.
- $517,314 — The typical DC metro area home price in September 2021, up from $456,329 in September 2020.
- 14.0 — The nationwide price-to-rent ratio (median home value divided by median annual rent) in September 2021, an increase from 13.0 in September 2020 and 11.6 in September 2015.
- 44 million — The number of renter households nationwide in the third quarter of 2021, an 870,000 increase from the first quarter of 2020.
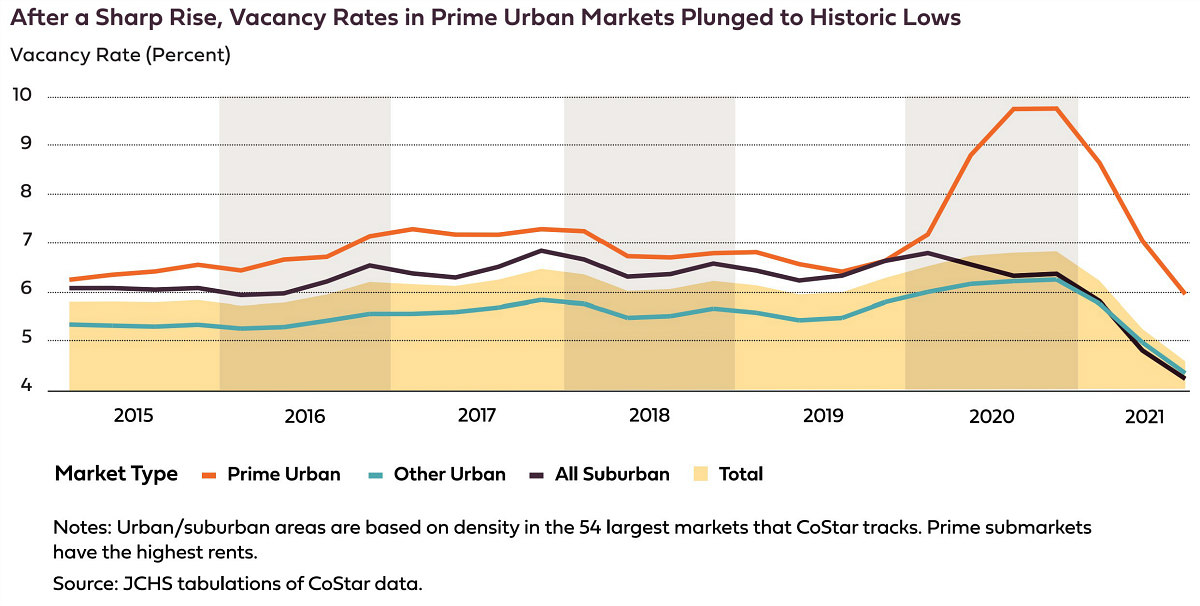
- 5.8% — The rental vacancy rate in the third quarter of 2021, down from 6.6% in the first quarter of 2020 and the lowest it has been since the mid-1980s.
- 74% — The share of investors' home purchases in Q3 2021 that were single-family homes, a record high.
- 15% — The share of renter households nationwide that were behind on rent in Q3 2021.
- 5% — The share of renter households nationwide that have an annual income of at least $75,000 and were behind on rent in Q3 2021.
- Almost 25% — The share of Black renter households behind on rent in Q3 2021, compared with 9% for white renter households.
- 49% — The share of federal Emergency Rental Assistance funds that were disbursed by the end of October 2021, impacting over 2.5 million households.
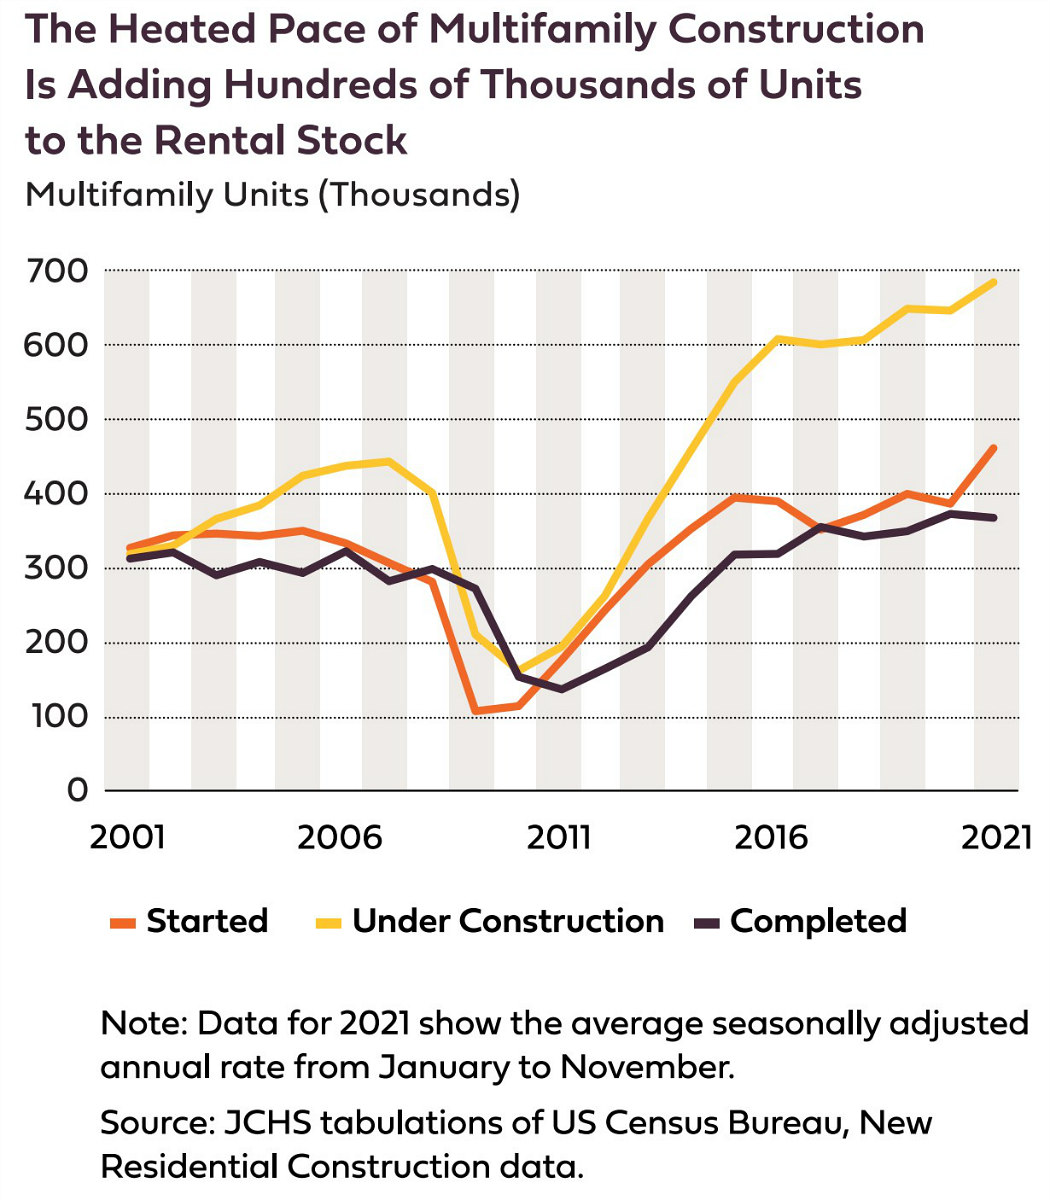
- 466,000 — The number of multifamily units started in the year ending November 2021, a three-decade high.
- 350,000 — The average number of annual multifamily unit starts from 2014-2020.
- Almost 650,000 — The number of multifamily units under construction nationwide.
- 375,000 — The number of multifamily units completed nationwide in 2020, the most since the 1980s. About half of these were in buildings with at least 50 units.
- 13% — The share of new-build rentals in 2020 that were single-family homes, an increase from 10% in 2014.
- 611,000 — The additional number of rental units occupied in the year ending Q3 2021, the largest annual increase since the 1990s.
- 28% — The share of respondents to a survey conducted by Fannie Mae who thought July 2021 was a good time to buy a home, down from 61% in June 2020.
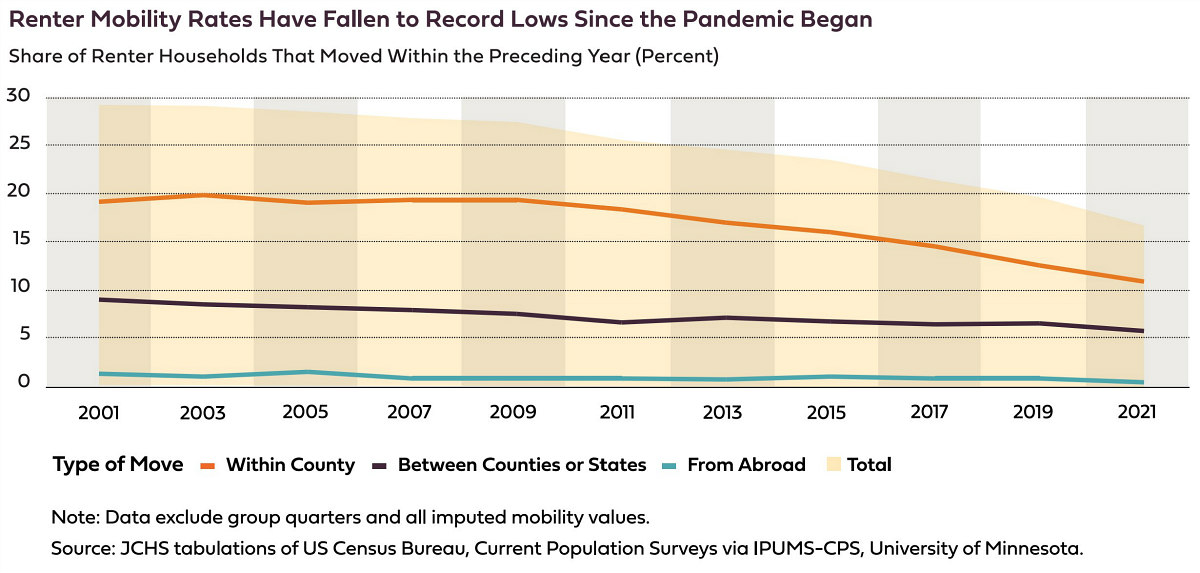
- 16.8% — The share of renter households who moved in 2021, compared to 18% in 2020 and 29.5% in 2001. Lease renewals hit a record high in September 2021.
- 17.6 million — The number of rental units at risk from natural disaster, compared to 33.9 million owner-occupied units.
See other articles related to: dc area rental market, harvard, joint center for housing studies, nationwide rental market
This article originally published at https://dc.urbanturf.com/articles/blog/what-a-new-report-says-about-the-state-of-the-us-rental-market/19170.


UrbanTurf Listings showcases the DC metro area's best properties available for sale.

Most Popular... This Week • Last 30 Days • Ever

The wait for Eataly in the DC area has been a long one.... read »
EYA and the Washington Metropolitan Area Transit Authority have requested a two-year ... read »

While the broader DC-area housing market grapples with elevated mortgage rates and ca... read »

At the $1 million mark, DC's market offers strikingly different products depending on... read »

Justice Roberts selling Maryland home; bathroom danger; and what will future stadiums... read »


DC Real Estate Guides
Short guides to navigating the DC-area real estate market
We've collected all our helpful guides for buying, selling and renting in and around Washington, DC in one place. Start browsing below!
First-Timer Primers
Intro guides for first-time home buyers
Unique Spaces
Awesome and unusual real estate from across the DC Metro