 Up and Down With A Lot of Sales: The Brookland Housing Market, By the Numbers
✉️ Want to forward this article? Click here.
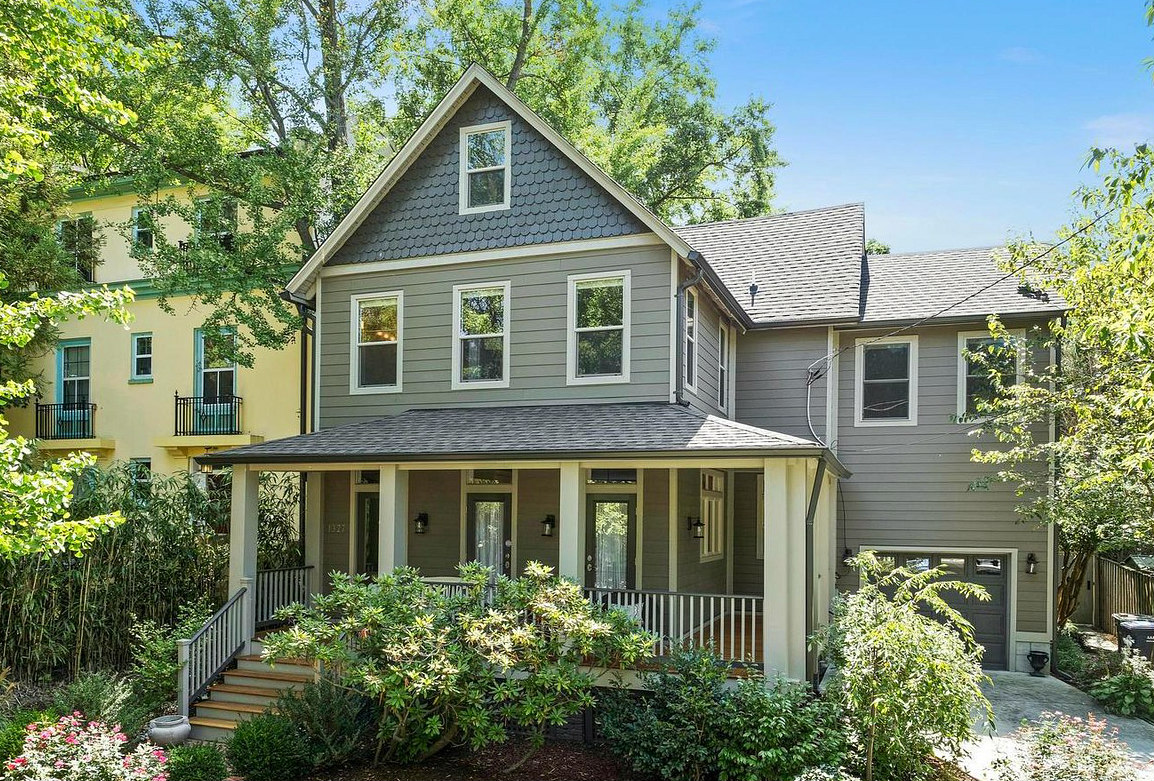
With the fall housing market in full swing, UrbanTurf is taking a look at the neighborhood markets around the DC region. Today, we head over to Brookland.
Brookland is one of the most active housing markets in DC. With 258 home sales, the Northeast DC neighborhood has the fourth highest number of closed sales in the city this year. Overall, the market in Brookland is fairly balanced this year, however it still has just a two-month supply of homes for sale. The trajectory of home prices varies pretty significantly depending on property type; the average price for a condo is up 13 percent year-over-year while the average price for a detached house is down 9 percent. Below are some statistics about the Brookland market.
story continues below
loading...story continues above
- $582,450 -- The median price for a home in Brookland, up six percent year-over-year.
- $427,620 -- The average price for a condo in Brookland, up 13 percent year-over-year.
- $882,496 -- The average price for a detached home in Brookland, down 9 percent year-over-year.
- 258 -- The number of closed sales in the neighborhood.
- 2.20 -- The supply of homes on the market in September.
See other articles related to: brookland, brookland home prices, brookland housing market
This article originally published at https://dc.urbanturf.com/articles/blog/up-and-down-with-a-lot-of-sales-the-brookland-housing-market-by-the-numbers/16052.
Most Popular... This Week • Last 30 Days • Ever
This article will delve into how online home valuation calculators work and what algo... read »
Navy Yard is one of the busiest development neighborhoods in DC.... read »

On Sunday, Sphere Entertainment Co. announced plans to develop a second U.S. location... read »
Carr Properties' planned conversion of a vacant nine-story office building into a 314... read »
While the national housing market continues to shift in favor of buyers, the DC regio... read »
DC Real Estate Guides
Short guides to navigating the DC-area real estate market
We've collected all our helpful guides for buying, selling and renting in and around Washington, DC in one place. Start browsing below!
First-Timer Primers
Intro guides for first-time home buyers
Unique Spaces
Awesome and unusual real estate from across the DC Metro

