 Two Reports Offer Perspective on How Opportunity Zones are Falling Short
✉️ Want to forward this article? Click here.
Opportunity Zones (OZs) are designated low-income census tracts where tax breaks are offered to incentivize investment, presumably correcting a legacy of underinvestment in those areas. However, there has been a significant about of criticism about the program since it was codified in 2018, including that some designated OZs were already slated for development or were "gerrymandered" to benefit wealthy and influential individuals.
The Urban Institute recently completed a qualitative study on OZs that seems to confirm the program's shortcomings in meeting its stated goals, particularly when it comes to connecting investors with organizations and entities on the ground in those areas. Many investors have also noted that the incentives are not enticing enough on their own to motivate backing a project that would not work without the tax break.
Additionally, the 10-year investment period needed to maximize those tax breaks is often misaligned with organizational needs, and those investments tend to be funneled toward real estate rather than businesses. And these are not the only ways OZs are performing in unintended ways — the designation also seems to be correlated with gentrification.
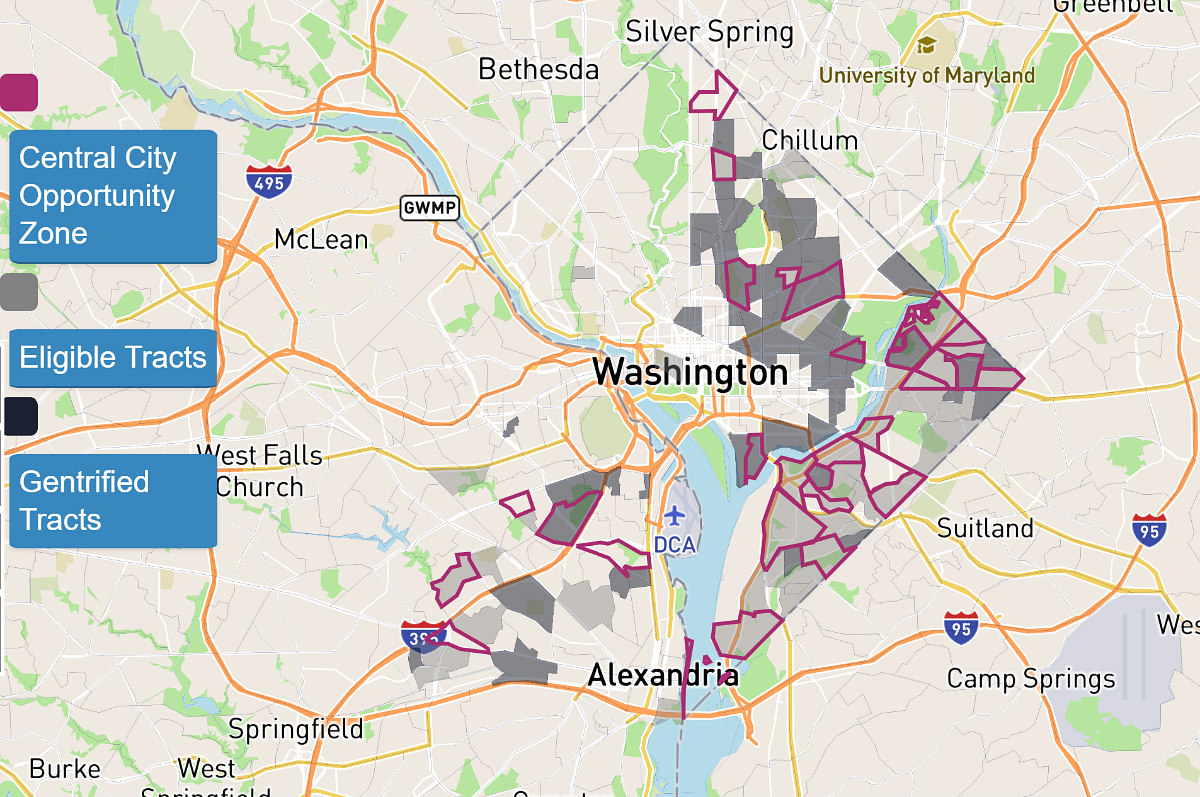
Last year, a report from the National Community Reinvestment Coalition (NCRC), along with others, identified DC as the most-gentrified city nationwide. Although NCRC's latest Gentrification and Displacement report kicks DC out of the top ten, its data shows that gentrification and OZs often overlap. Nationwide, 69% of gentrifying areas either abutted or included OZs, and 179 of 954 gentrifying neighborhoods are designated OZs. Here are the seven DC OZs that also gentrified prior to designation:
- The census tract just west of (and including the address to the redevelopment of) the McMillan Sand Filtration Site, roughly between Georgia Avenue and First Street, from Irving Street to Florida Avenue NW.
- The Brentwood census tract between New York and Rhode Island Avenues, bound by 18th Street NE and the train tracks dividing it from Eckington.
- The Carver-Langston census tract east of the Starburst intersection, bound by Benning Road, Maryland Avenue and 26th Street NE.
- The Mayfair census tract east of the Anacostia River and south of the Watts Branch, between Kenilworth Avenue and Benning Road NE.
- The Lincoln Heights/Deanwood census tract straddling Nannie Helen Burroughs Avenue between 44th and Division Avenues from Hayes Street to East Capitol Street NE; this includes the sites of the future Deanwood Town Center and redeveloped Strand Theater.
- The Buzzard Point census tract (home to Audi Field), from South Capitol Street to Delaware and 5th Avenues SW beneath M Street.
- The historic Anacostia census tract bound by the Anacostia Freeway, Good Hope Road, and Morris, 16th and Bangor Streets SE, which now includes the first Busboys and Poets east of the River (and Anacostia's first Starbucks).
NCRC measures gentrification by looking at the change in median income, home value, and gentrification level in a given area from 2013-2017.
Additional UrbanTurf reporting on Opportunity Zones:
- The DC Opportunity Zones That Saw Home Prices Pop Over the Last Year
- The Opportunity Zone Effect? Home Prices up 20 Percent in OZs Nationwide
- Maryland Site Offers the Opportunity to Own in Opportunity Zones
- Executive Order Expected to Grease the Wheels in Opportunity Zones
- Tax Rules Released Regarding Opportunity Zones
- DC Nominates 25 Opportunity Zones
See other articles related to: gentrification, investor opportunity, investors, national community reinvestment coalition, opportunity zones, real estate investing, the urban institute, urban institute
This article originally published at https://dc.urbanturf.com/articles/blog/two-reports-offer-perspective-on-how-opportunity-zones-are-falling-short/16985.


UrbanTurf Listings showcases the DC metro area's best properties available for sale.

Most Popular... This Week • Last 30 Days • Ever

UrbanTurf is re-running its primer on property taxes which outlines a few things that... read »
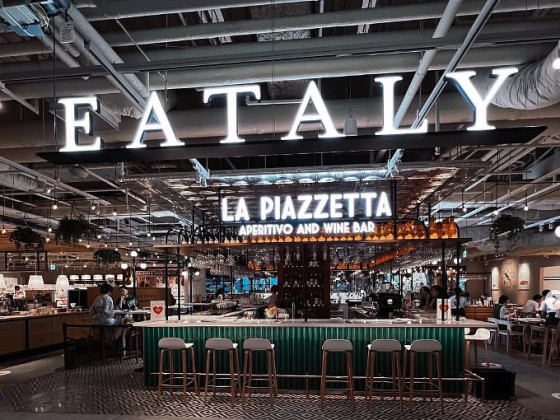
The wait for Eataly in the DC area has been a long one.... read »
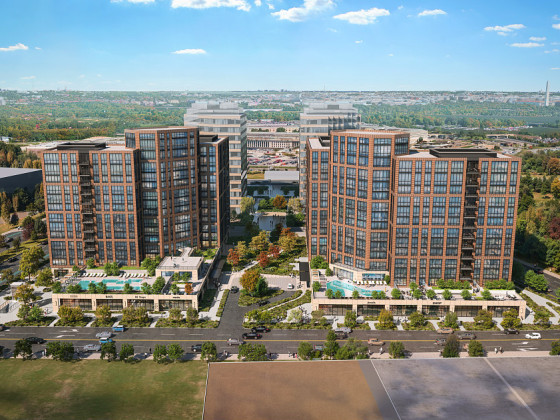
The Arlington County Board signed off on a pair of transformative residential project... read »
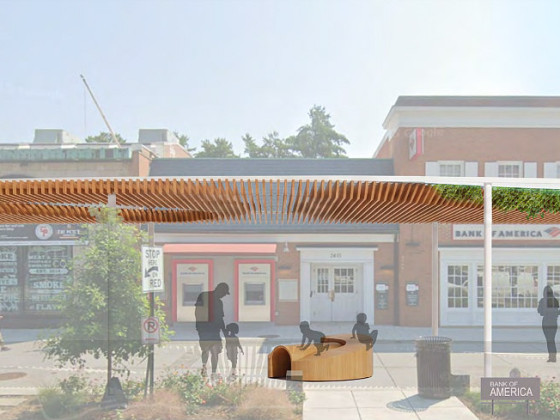
The plan to add a shade structure along the Cleveland Park commercial corridor has re... read »

DOGE doesn't seem dead yet; Monument buys Inn of Rosslyn; and Costco gas stations are... read »


DC Real Estate Guides
Short guides to navigating the DC-area real estate market
We've collected all our helpful guides for buying, selling and renting in and around Washington, DC in one place. Start browsing below!
First-Timer Primers
Intro guides for first-time home buyers
Unique Spaces
Awesome and unusual real estate from across the DC Metro