 The DC Opportunity Zones That Saw Home Prices Pop Over the Last Year
✉️ Want to forward this article? Click here.
Last April, 25 Opportunity Zones (OZs) were identified in Washington, DC, and earlier this year, a study showed an inconsistent, but measurable uptick in housing prices in OZs nationwide. Now, a new report takes a more granular look at how home prices have changed since OZs were announced.
Established as part of the 2017 tax reform bill, Opportunity Zones are low-income census tracts where investors can pool money to bankroll businesses and developments while deferring taxes on gains from sales of assets within those tracts for a period of time.
An ATTOM Data Solutions study released today shows that almost half of the nearly 3,700 zones studied saw higher home price growth than what was observed nationwide (8.3 percent). The study highlighted data from 17 of the 25 OZs in DC, and the tracts with the highest price growth are included in the table below. (Note: Tracts with more than one quarter of missing data are not included.)
story continues below
loading...story continues above
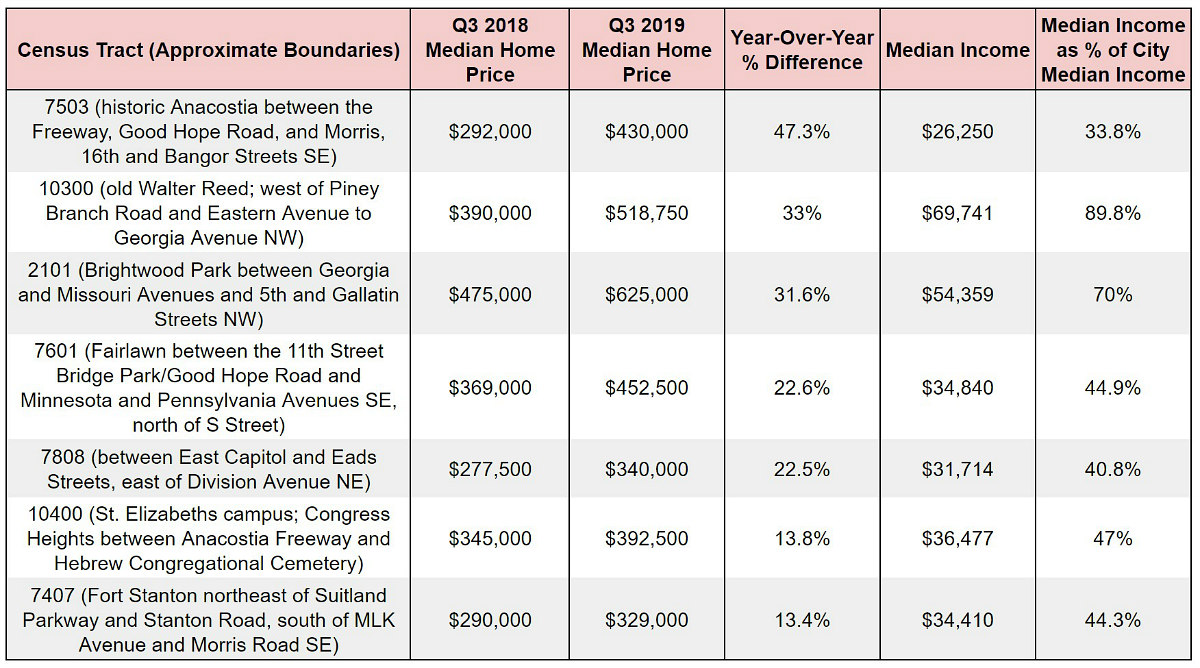
Based on the above parameters, the OZ with the highest year-over-year home price increase is not included in the table: the 7304 census tract, where prices went up 152 percent between the third quarter of 2018 ($153,750) and the third quarter of 2019 ($387,500). Located in Congress Heights southeast of Alabama Avenue and Wheeler Road, this tract had insufficient data for median home prices in the first and second quarters of 2019, making it hard to determine whether the jump is a trend or an anomaly.
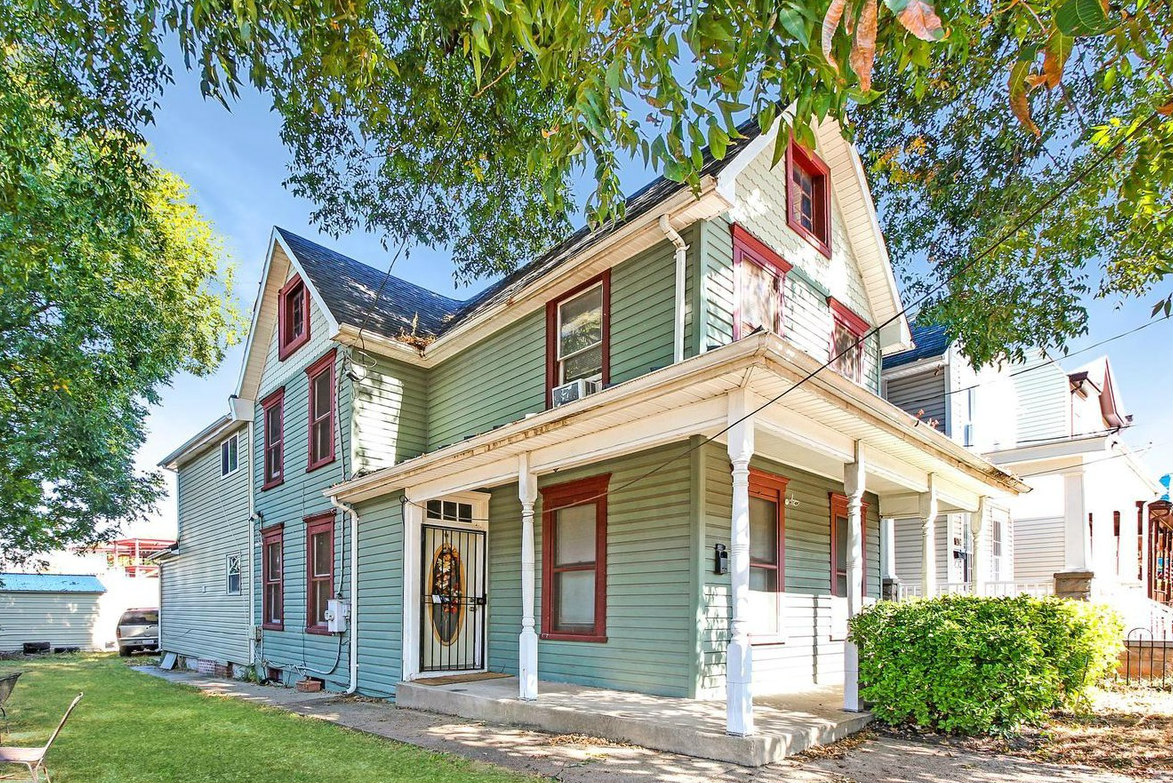
Otherwise, the nearby 7503 census tract of historic Anacostia had the highest price growth, jumping 47 percent from $292,000 to $430,000. The census tract with the second highest price growth includes Walter Reed and a portion of Takoma, where the median income is the highest of any of the OZs studied. Prices in this tract rose by 33 percent, from $390,000 to $518,750.
There are three OZs where prices fell, with the most drastic price drop occurring in the 7603 census tract, southeast of Alabama Avenue and Naylor Road SE. Here, prices fell by 32.5 percent year-over-year, from $312,500 to $210,908. The other two OZs where prices dropped are also in Southeast; prices dropped by 11 percent in the 7604 census tract (northeast of Alabama Avenue and Naylor Road) and by 8.6 percent in the 7803 census tract (Central Northeast between Benning Road and Nannie Helen Burroughs Avenue NE).
The report uses median incomes from Census data and recorded sales deeds, only analyzing quarters where at least five sales were made, and census tracts where at least five sales were made per quarter between the first quarter of 2005 and the third quarter of 2019.
See other articles related to: attom data solutions, census tracts, dc home prices, median home prices, opportunity zones
This article originally published at https://dc.urbanturf.com/articles/blog/this-east-of-the-river-census-tract-saw-highest-price-growth-of-all-dc-oppo/16170.


UrbanTurf Listings showcases the DC metro area's best properties available for sale.

Most Popular... This Week • Last 30 Days • Ever
EYA and the Washington Metropolitan Area Transit Authority have requested a two-year ... read »

While the broader DC-area housing market grapples with elevated mortgage rates and ca... read »
From the Maryland line down to the edge of downtown, a mix of office conversions, inf... read »

Dulles International Airport is slated for its biggest transformation since it opened... read »
Close-in suburbs are seeing some of the steepest rent declines in the region, while s... read »


- Rising Costs Stall 434-Unit Takoma Metro Project, Developer Seeks More Time
- The DC-Area Luxury Market Is Playing By Its Own Rules
- 1,800 Units In The Works: Connecticut Avenue's Building Boom
- Trump Administration Unveils $22 Billion Overhaul of Dulles International Airport
- Across The DC Region, Rent Growth Is Splitting Along The Beltway
DC Real Estate Guides
Short guides to navigating the DC-area real estate market
We've collected all our helpful guides for buying, selling and renting in and around Washington, DC in one place. Start browsing below!
First-Timer Primers
Intro guides for first-time home buyers
Unique Spaces
Awesome and unusual real estate from across the DC Metro