What's Hot: Douglas Development Files PUD For Large Warehouse At New City Site Along New York Avenue
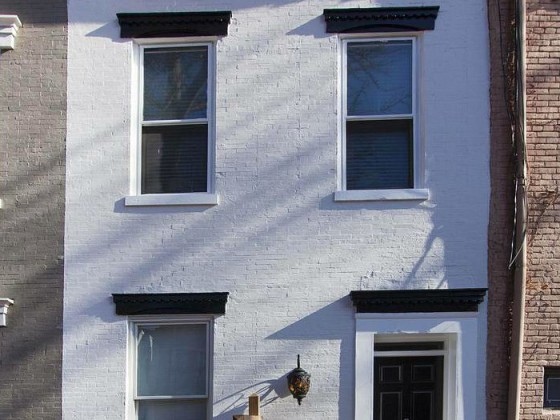
 The Difference That Seven Years Makes in DC's Housing Market
✉️ Want to forward this article? Click here.
Last week, UrbanTurf examined demographic data from the American Community Survey showing how the District has evolved since the recession. This week, we take a look at how the demographics and affordability of DC households has changed from 2009 to 2016.
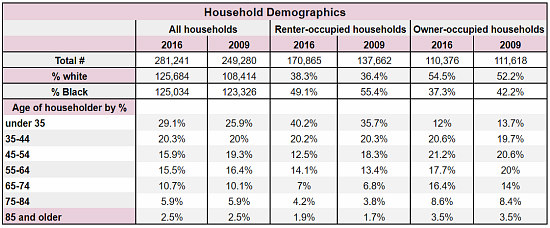
Demographics of DC households
- Forty percent of renting households in the District in 2016 were led by persons 35 years old or younger. While the proportion of millennial-led households increased by over 3 percent during that span, the city lost 45-54 year-olds at practically the same rate. Other age groups have maintained a relatively steady proportion of the city’s households.
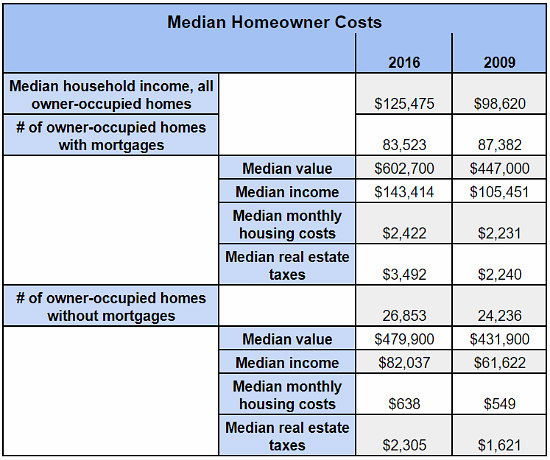
Owner-occupied housing costs
- There has been a one-percent drop in the number of owner-occupied households between 2009 and 2016, however this decrease has only been seen for mortgaged housing; the number of owner-occupied households without mortgages has increased by nearly 11 percent.
story continues below
loading...story continues above
Considering that the median income for all owner-occupied housing rose from $98,620 to $125,475 over the last seven years — practically mirroring the median incomes for white households in those years — it stands to reason from the data above that a lot more homes are being sold in all-cash purchases.
- Home values for mortgaged owner-occupied homes have increased by 35 percent between 2009 and 2016, from $447,000 to $602,700, and median real estate taxes have shot up by 56 percent in the same period.
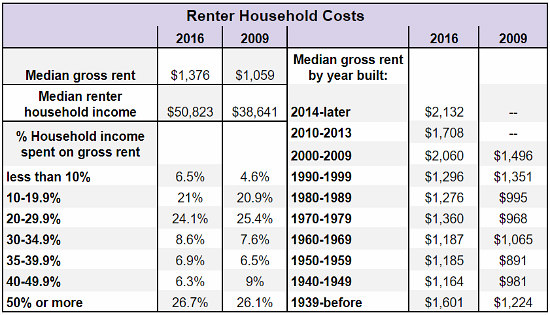
Renter-occupied housing costs
- Although a slightly larger share of renters are feeling cost-burdened, spending over half their income in rent, the increase of high-earning households means that the share of renters who spent less than one-third of their income in rent last year also increased compared to 2009. Forty-five percent of renters spent between 10-30 percent of household income on rent in 2016 compared to 26.7 percent of renters who spent more than half of their income on rent. From 2009 to 2016, the median income for all renter households in the District increased by 31.5 percent.
Some other interesting points:
- The median rent for housing built in the 1990s has decreased from $1,351 to $1,296 since 2009 — the only decade for which housing costs have gone down.
- The median rent for housing constructed from 2000-2009 ($2,060) is higher than the median rent for housing constructed between 2010-2013 ($1,708).
See other articles related to: affordability, census, dc home and condo prices, dc housing inventory, dc housing prices, housing, housing inventory, housing market
This article originally published at https://dc.urbanturf.com/articles/blog/the_difference_that_seven_years_makes_in_dcs_housing_market/13030.


UrbanTurf Listings showcases the DC metro area's best properties available for sale.
Most Popular... This Week • Last 30 Days • Ever

When you buy a home in the District, you will have to pay property taxes along with y... read »
The largest condominium building in downtown DC in recent memory is currently under c... read »
The plan to convert a Dupont Circle office building into a residential development ap... read »
The Rivière includes just 20 homes located on the eastern banks of the Anacostia Riv... read »

Why Tyra Banks is serving ice cream in DC; a bike shop/record store opens in Adams Mo... read »


DC Real Estate Guides
Short guides to navigating the DC-area real estate market
We've collected all our helpful guides for buying, selling and renting in and around Washington, DC in one place. Start browsing below!
First-Timer Primers
Intro guides for first-time home buyers
Unique Spaces
Awesome and unusual real estate from across the DC Metro