 An 8-Year Snapshot of Mount Pleasant Home Prices in Three Charts
✉️ Want to forward this article? Click here.
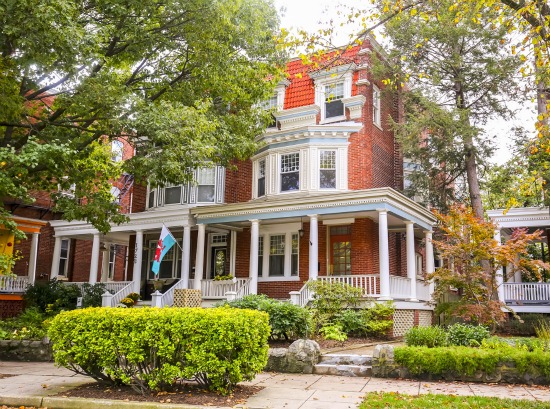
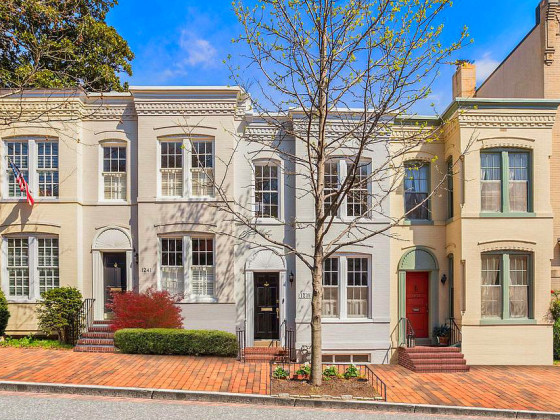
A home in Mount Pleasant.
Although the DC area weathered the storm of the 2008 recession better than many other parts of the country, home prices in some neighborhoods have had it rougher than others — especially depending on the type of house. UrbanTurf has spent 2016 taking a look at neighborhoods in the area to see how housing prices have fared over the last eight years.
We have examined Capitol Hill; the zip code that includes Shaw, Bloomingdale, LeDroit Park and Mount Vernon Square; Chevy Chase DC; Trinidad; Columbia Heights; the zip code including Historic Anacostia, Naylor Gardens and Hillcrest; Petworth; Cleveland Park; and Georgetown.
This week, we are taking a look at how prices fared in Mount Pleasant.
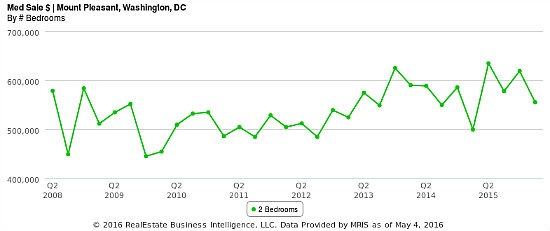
Slight Depreciation For Two-Bedrooms
Although a glance at the above graph may give the impression of a decent, if not flat, run for two-bedroom condos and co-ops in Mount Pleasant, the inflation-adjusted numbers aren’t quite as encouraging. A semi-bumpy ride led to prices falling from $643,429 in the second quarter of 2008 to $625,365 in the final quarter of 2015. Despite the drop, prices have been relatively stable in this submarket since 2010, after hitting a low of $496,841 in the fourth quarter of 2009.
story continues below
loading...story continues above
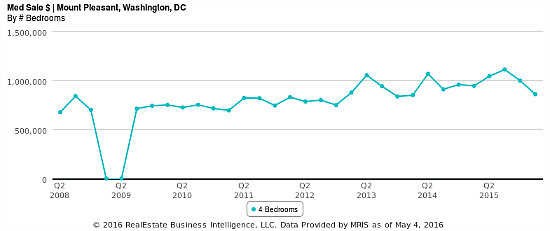
A 34 Percent Price Jump For Four-Bedroom Townhomes
The median price of four-bedroom rowhouses in Mount Pleasant fluctuated a lot through early 2009 — in the first two quarters of that year, there weren’t even any sales of this popular property type and size. Prices then gradually stabilized, hovering in the $700,000-plus range before spiking and hitting an inflation-adjusted $1,081,803 in 2013. Last year was a banner year for this submarket, with prices hitting a high of $1,123,033 in the third quarter before settling at $1,008,963. So, between the second quarter of 2008 when the median price was $751,500, and the beginning of this year, prices have risen 34 percent.
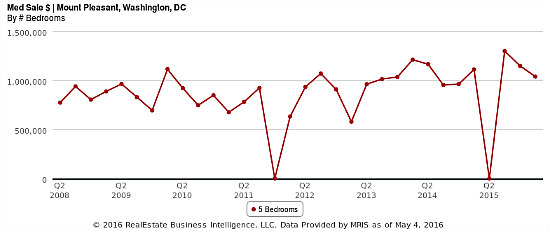
Five-Bedroom Rowhouses Also See Significant Appreciation
Despite ups and downs, prices for five-bedroom rowhouses in Mount Pleasant have increased by 35 percent, jumping from a second-quarter 2008 median of $860,683 to $1.16 million in the fourth quarter of 2015. This makes for an annual inflation-adjusted appreciation of 3.81 percent.
(Note: The dip to zero on the above charts represent quarters in which no houses in that submarket sold in the neighborhood.)
See other articles related to: dc area market trends, dc housing prices, mount pleasant, mount pleasant home prices
This article originally published at https://dc.urbanturf.com/articles/blog/the_8-year_snapshot_of_mount_pleasant_home_prices_in_three_charts/11276.




UrbanTurf Listings showcases the DC metro area's best properties available for sale.
Most Popular... This Week • Last 30 Days • Ever

A look at the closing costs that homebuyers pay at the closing table.... read »
UrbanTurf is re-publishing an article with updated links that is a step-by-step way t... read »

The plan unveiled Sunday for East Potomac Golf Links would make the course a very dif... read »
The images recently filed with DC's Historic Preservation Office show the vision for ... read »
A sprawling new residential community has been pitched in Clarksburg.... read »



DC Real Estate Guides
Short guides to navigating the DC-area real estate market
We've collected all our helpful guides for buying, selling and renting in and around Washington, DC in one place. Start browsing below!
First-Timer Primers
Intro guides for first-time home buyers
Unique Spaces
Awesome and unusual real estate from across the DC Metro
