 The 8-Year Path of Georgetown Home Prices in Four Charts
✉️ Want to forward this article? Click here.
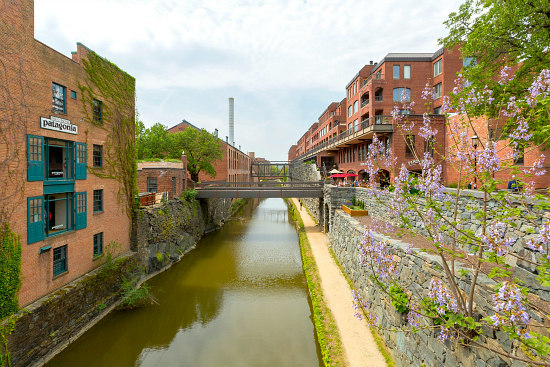
While the 2008 recession caused upheaval in the housing market nationwide, many neighborhoods in the DC area managed to escape the worst of the tumult. UrbanTurf has spent 2016 taking a look at neighborhoods in the area to see how housing prices have fared over the last eight years.
We have examined Capitol Hill; the zip code that includes Shaw, Bloomingdale, LeDroit Park and Mount Vernon Square; Chevy Chase DC; Trinidad; Columbia Heights; the 20020 zip code, which includes Historic Anacostia, Naylor Gardens and Hillcrest; Petworth; and Cleveland Park.
This week, we are taking a look at how prices fared in Georgetown.
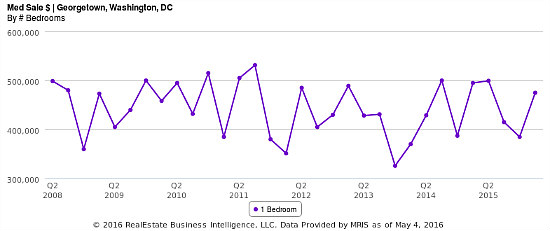
A Bumpy Ride for One-Bedrooms
The median price for a one-bedroom unit in Georgetown has had a rocky run over the past eight years. While the inflation-adjusted median was $551,633 back in 2008, prices peaked in the third quarter of 2011 ($562,409) before dropping 31 percent to $386,811 in late 2015. Current prices are a 16 percent recovery from the low of $333,242 in the last quarter of 2013.
story continues below
loading...story continues above
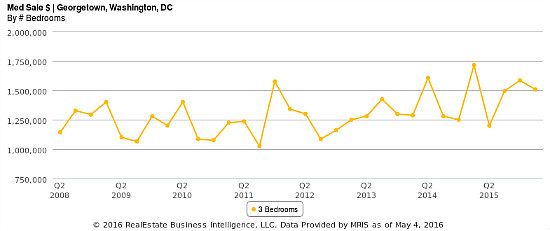
A 26 Percent Increase For Three-Bedroom Prices
The three-bedroom submarket was much more stable than that of one-bedroom units, with prices vacillating between 2008 and 2016 but still showing a 26 percent median price increase — 2.92 percent annual appreciation — over that time. The third quarter of 2011 was a low point in the market, with median prices for three-bedroom rowhouses dropping to $1,085,118. Despite the dip, prices closed the year at $1,667,376. 2015 was perhaps the strongest year since 2008, as three-bedrooms hit a high of $1,723,068 in the first quarter before dropping to $1,591,200 by year’s end.
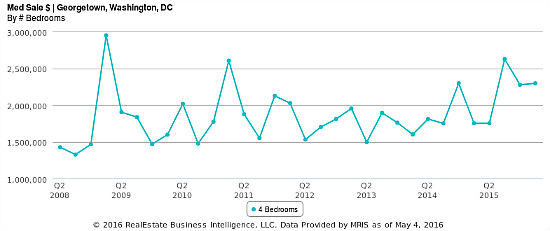
2015 Also a Vintage Year For Four-Bedroom Townhomes
In a trend that runs counter to how prices fared across the city immediately after the recession, four-bedroom rowhomes in Georgetown peaked soon after their 2008 lows ($1,576,096 and $1,466,045 in the second and third quarters, respectively), hitting an inflation-adjusted median of $3,271,669 in the beginning of 2009. Prices have trended upward since hitting an 8-year low of $1,528,210 in the second quarter of 2013. Overall, the late-2015 median of $2,285,702 is a 45 percent increase over the second quarter-2008 median of $1,576,096, an increase that represents an annual appreciation of 4.76 percent .
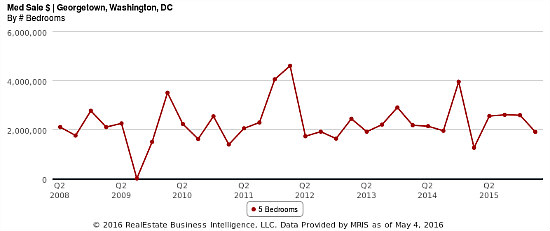
Flatter, Yet Fluctuating Prices on Five-Bedrooms
Values for five-bedroom homes rose 1.4 percent annually or 11.87 percent in total between 2008 and the end of 2015 before dipping back down to $1.9 million in the first quarter of 2016. The unpredictable direction for prices over the last eight years — $4.6 million in the first quarter of 2012 to $1.2 million at the beginning of 2015 — shows just how variable prices can be for this property type.
(Note: The dip to zero on the chart represents a quarter in which no five-bedroom homes sold in the neighborhood.)
See other articles related to: georgetown condos, georgetown home prices
This article originally published at https://dc.urbanturf.com/articles/blog/the_8-year_rise_of_georgetown_home_prices_in_three_charts/11239.


UrbanTurf Listings showcases the DC metro area's best properties available for sale.

Most Popular... This Week • Last 30 Days • Ever

UrbanTurf is re-running its primer on property taxes which outlines a few things that... read »

The wait for Eataly in the DC area has been a long one.... read »
The Arlington County Board signed off on a pair of transformative residential project... read »
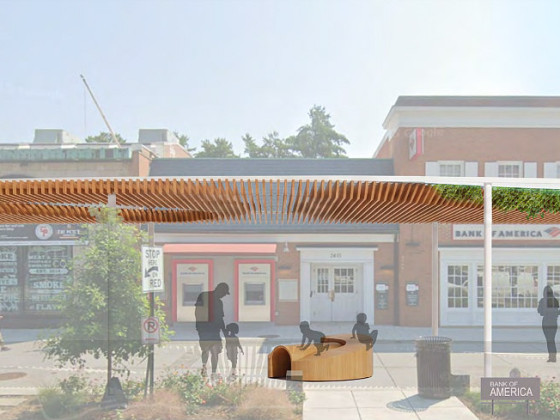
The plan to add a shade structure along the Cleveland Park commercial corridor has re... read »

DOGE doesn't seem dead yet; Monument buys Inn of Rosslyn; and Costco gas stations are... read »


DC Real Estate Guides
Short guides to navigating the DC-area real estate market
We've collected all our helpful guides for buying, selling and renting in and around Washington, DC in one place. Start browsing below!
First-Timer Primers
Intro guides for first-time home buyers
Unique Spaces
Awesome and unusual real estate from across the DC Metro