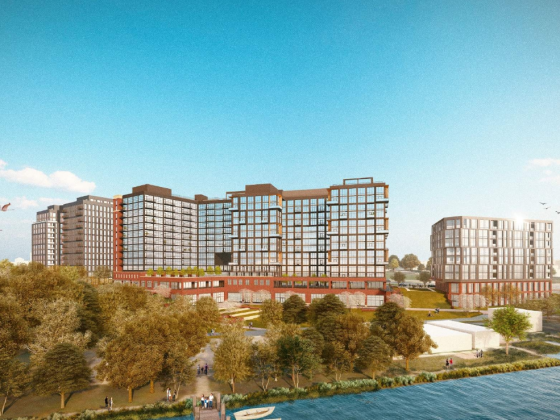
What's Hot: Raze Application Filed For Site Of 900-Unit Development, Food Hall Along Anacostia River
 Summer Slowdown: A Look at the DC-Area Housing Market, By the Numbers
✉️ Want to forward this article? Click here.
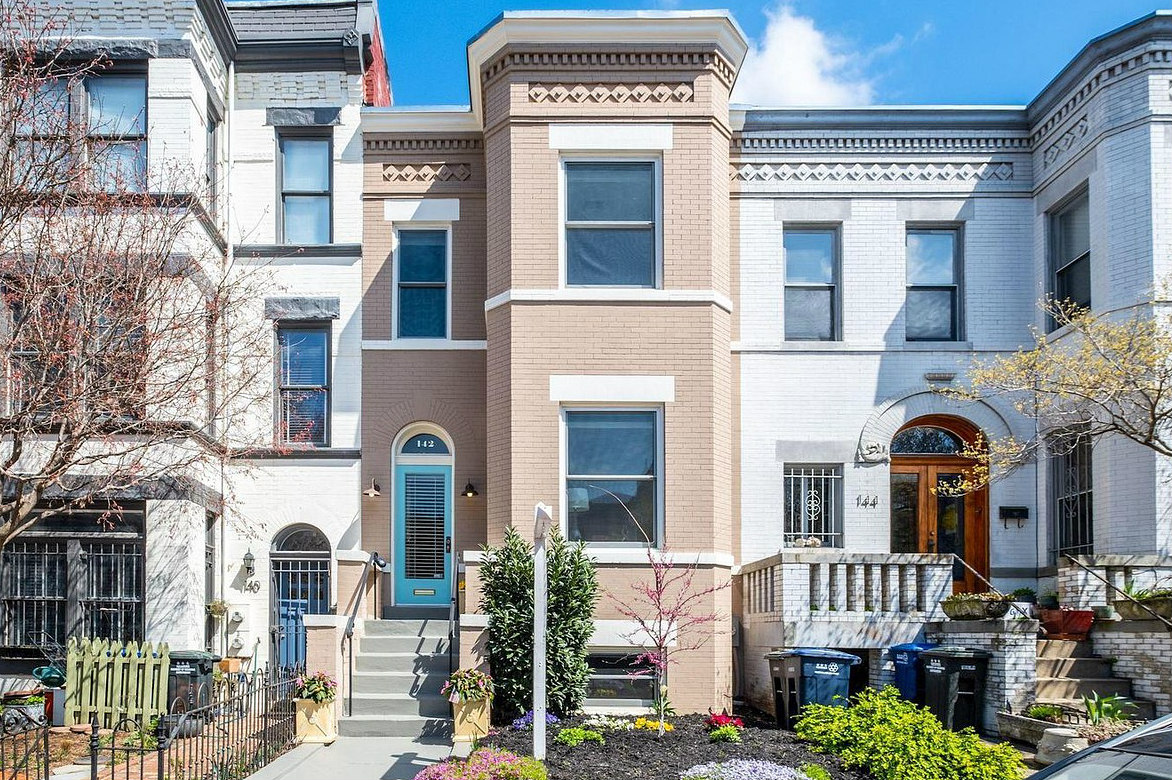
Call it the dog days of summer or a reset, but there was little doubt that the housing market in the DC region slowed down in July. Home prices rose at their slowest level in months, as inventory increased and home showings fell about 30% year-over-year. Consequently, the number of days that listings are spending on the market went up in almost every local jurisdiction.
Below, UrbanTurf plucked out some of the more telling statistics from the market last month.
story continues below
loading...story continues above
- $562,766 -- The median price for a home in the DC area in July, up slightly compared to last July.
- 8,101 -- The number of active listings on the market in July, up 16% compared to a year ago.
- 1.32 -- The monthly supply of active listings in the DC region, up 27% compared to last July.
- 111,837 -- The total number of home showings in the region last month, down 30% year-over-year.
- 5,456 -- The number of homes sold in the region, down 27% from July 2021.
See other articles related to: dc area housing market, dc housing market
This article originally published at https://dc.urbanturf.com/articles/blog/summer-slowdown-a-look-at-the-dc-area-housing-market-by-the-numbers/19965.
Most Popular... This Week • Last 30 Days • Ever

Estate taxes, also known as inheritance taxes or death duties, are taxes imposed on t... read »
In this article, UrbanTurf will explore the considerations and steps involved in buyi... read »
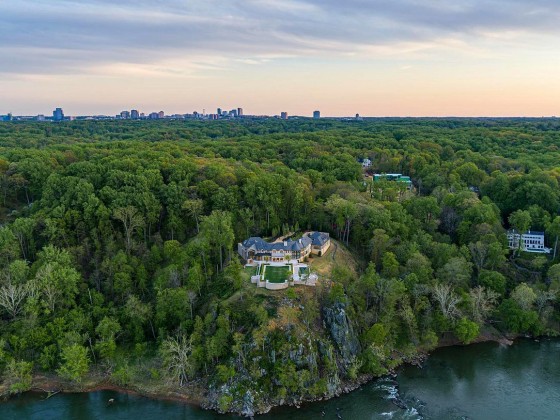
The most expensive home to sell in the DC region in years closed on Halloween for an ... read »
Paradigm Development Company has plans in the works to build a 12-story, 110-unit con... read »
The application may signal movement on the massive mixed-use project.... read »
- What Are Estate Taxes and How Do They Work?
- How An Unmarried Couple Buys a Home Together
- The Cliffs in McLean Sells For $25.5 Million, Highest Home Sale In DC Area In Years
- 110-Unit Condo Project Planned in Alexandria Coming Into Focus
- Raze Application Filed For Site Of 900-Unit Development, Food Hall Along Anacostia River
DC Real Estate Guides
Short guides to navigating the DC-area real estate market
We've collected all our helpful guides for buying, selling and renting in and around Washington, DC in one place. Start browsing below!
First-Timer Primers
Intro guides for first-time home buyers
Unique Spaces
Awesome and unusual real estate from across the DC Metro


