What's Hot: Rising Costs Stall 434-Unit Takoma Metro Project | The DC-Area Luxury Market Is Playing By Its Own Rules
 Market Watch: The Rough Housing Market of 20032
✉️ Want to forward this article? Click here.
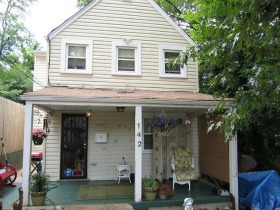
Home for sale in 20032
Housing Market Watch is a weekly feature on UrbanTurf in which Keith Gibbons, the brains behind DCHousingPrices.com analyzes recent MRIS statistics for a specific zip code in the DC region to help paint a picture of the housing market in that area.
With this post, I’ll have analyzed home sales for every DC zip code, save for 20004. To wrap up the first tour of DC, we look at July sales for zip code 20032, which forms the District’s southeast tip, bordered by the Potomac and Anacostia Rivers and the District/Maryland line. Bisected by I-295, it’s home to Bolling Air Force Base and the St. Elizabeth’s campus, as well as the Congress Heights neighborhood.
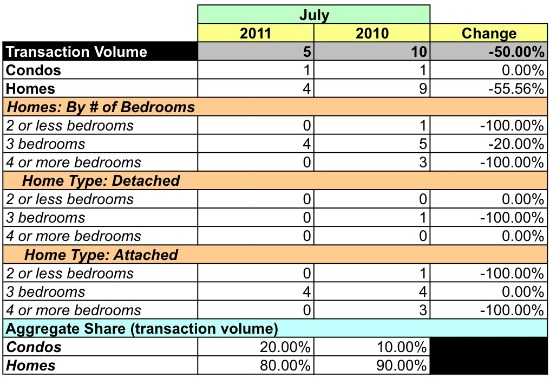
In July, just five homes sold in 20032. Here is a chart providing a year-over-year comparison of sales volume, median price and average price:
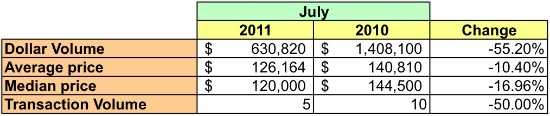
20032 Market Summary
The housing market in the 20032 zip code may be one of the worst off within the DC borders. The total dollar volume of sold homes in July was down 55 percent versus the same month in 2010, and unit sales decreased about 50 percent. The average home price fell 10.4 percent, and the median price dropped about 17 percent. Two of the five homes sold were bank-mediated sales with a median price of $51,600. The average monthly sales volume in 20032 over the past year has been two detached homes, seven row homes, and two condos.
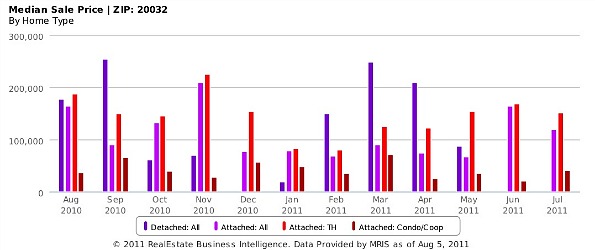
Median home sales prices in 20032 since August 2010.
There were 77 active listings on the market in 20032 in July — 28 condos and 49 houses. The list prices for condos topped out at $300,000, and almost all houses ranged in price from $50,000 to $300,000.
20032 was barely on the map as a portion of District sales in July: It represented 0.18 percent of total monthly dollar volume for the city. To put the cost of home ownership in perspective compared to the rest of DC, the average home price in July was 78.76 percent less than the overall city average, and the median sales price was 73 percent lower. While properties in 20032 sold for 94.2 percent of their asking price, a 12 percent improvement from 2010, at July’s sales pace there’s a whopping 28-month supply of condos and a 12.25-month supply of houses currently on the market. Things could be picking up for the area, though: 31 homes went under contract/contingent contract in July.
Below are charts that provide more detailed statistics of the market in 20032.
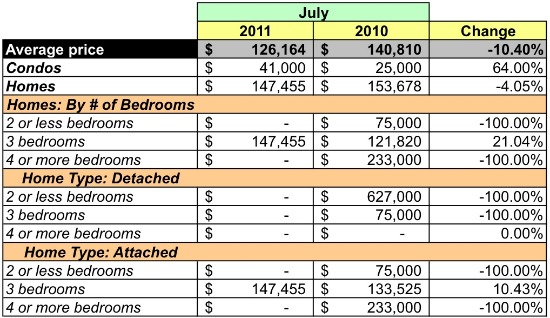
Average Sales Price
Unit Sales Volume
Similar Posts:

This article is based on custom data provided to UrbanTurf by MRIS, a developer of real estate technology and information as well as the largest multiple listing service (MLS) in the United States.
See other articles related to: 20032, dclofts, market watch
This article originally published at https://dc.urbanturf.com/articles/blog/market_watch_the_rough_housing_market_of_20032/4074.


UrbanTurf Listings showcases the DC metro area's best properties available for sale.

Most Popular... This Week • Last 30 Days • Ever

The wait for Eataly in the DC area has been a long one.... read »
EYA and the Washington Metropolitan Area Transit Authority have requested a two-year ... read »

While the broader DC-area housing market grapples with elevated mortgage rates and ca... read »

At the $1 million mark, DC's market offers strikingly different products depending on... read »

Justice Roberts selling Maryland home; bathroom danger; and what will future stadiums... read »


DC Real Estate Guides
Short guides to navigating the DC-area real estate market
We've collected all our helpful guides for buying, selling and renting in and around Washington, DC in one place. Start browsing below!
First-Timer Primers
Intro guides for first-time home buyers
Unique Spaces
Awesome and unusual real estate from across the DC Metro