 Market Watch: Logan Circle, Columbia Heights, Dupont Circle
✉️ Want to forward this article? Click here.
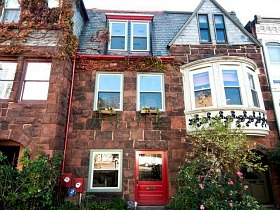
Home under contract on V Street.
Housing Market Watch returns this week after a little hiatus. Keith Gibbons, the brains behind DCHousingPrices.com, has a new and improved way to analyze recent MRIS statistics for specific zip codes in the DC region that gives a more in-depth look at the housing market in those areas.
Editor’s Note: Analyzing real estate data by zip code is about as granular as one can get in DC, as MRIS does not provide neighborhood-specific data sets. So, it should be kept in mind that this analysis includes home price data for Columbia Heights as well as Dupont Circle, where prices can be considerably higher.
It’s been awhile since I posted a zip code sales analysis, but now I’m back! A few things have changed, however, as I’ve revamped my analysis based on your feedback. You’ll see three major changes going forward:
- I now provide zip code sales and price data in three-month windows for the current and prior year (e.g., August-October 2010 and 2011). This is to provide more sufficient insight into sales trends in a given zip code.
- I have switched the places of the data columns, so the 2010 column is now on the left, and the 2011 column is on the right.
- Finally, I’ve combined the data and put it all into one table. I’ll probably be adjusting the table over the next few weeks, so your suggestions for improvements are welcomed.
This week, I have analyzed home sales data for the 20009 zip code. Roughly speaking, 20009 is bordered to the north by Irving Street, to the west by Connecticut Avenue, to the east by 11th Street and to the south by Q Street NW. Portions of Dupont Circle (excluding the circle itself), Logan Circle, Columbia Heights, the U Street Corridor and Adams Morgan are encompassed within those borders.
Forty-seven units sold in 20009 in October 2011. Here are some key points in October’s data:
- Total unit sales were 9.62 percent lower than the previous year. Eight houses were sold for an average price of $796,125, down 16.8 percent. Thirty-nine condos were sold for an average price of $402,850, down 11.44 percent.
- There were 208 active listings in October: 183 condos and 25 single-family homes. More than half of the condos listed were priced between $200,000 and $499,000 and most of the houses were listed above $500,000.
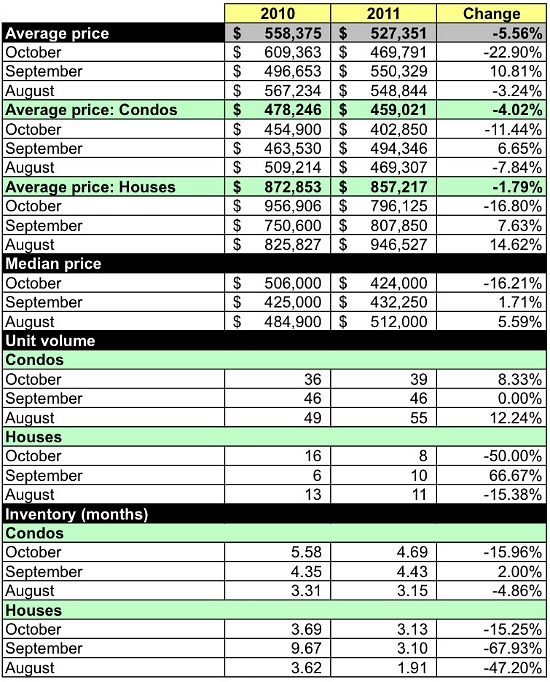
According to MRIS, properties in 20009 sold for 94.8 percent of their listing price in October, a slight dip from 2010. Overall, homes are selling quickly in 20009 – the average days on market fell to 62, down almost 13 percent from October 2010. Looking ahead, 48 homes went under contract in October and another 45 went under a contingent contract.
Perhaps the biggest takeaway from the data above is just how tight inventory is in the zip code right now. The chart above shows that the inventory for both single-family homes and condos for sale in 20009 dropped between August, September and October 2010 and those same months this year. (The only exception being a small increase in condo inventory between September 2010 and September 2011.) Also, in every month above except for one, housing inventory fell below the healthy benchmark of a six-month supply.

This article is based on custom data provided to UrbanTurf by MRIS, a developer of real estate technology and information as well as the largest multiple listing service (MLS) in the United States.
See other articles related to: dc home and condo prices, dc home prices, dclofts, logan circle, market watch
This article originally published at https://dc.urbanturf.com/articles/blog/housing_market_watch_200091/4624.


UrbanTurf Listings showcases the DC metro area's best properties available for sale.

Most Popular... This Week • Last 30 Days • Ever

UrbanTurf is re-running its primer on property taxes which outlines a few things that... read »

The wait for Eataly in the DC area has been a long one.... read »
EYA and the Washington Metropolitan Area Transit Authority have requested a two-year ... read »

The plan to add a shade structure along the Cleveland Park commercial corridor has re... read »

At the $1 million mark, DC's market offers strikingly different products depending on... read »


DC Real Estate Guides
Short guides to navigating the DC-area real estate market
We've collected all our helpful guides for buying, selling and renting in and around Washington, DC in one place. Start browsing below!
First-Timer Primers
Intro guides for first-time home buyers
Unique Spaces
Awesome and unusual real estate from across the DC Metro