 DC Real Estate By The Numbers in 2015
✉️ Want to forward this article? Click here.
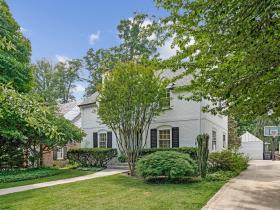
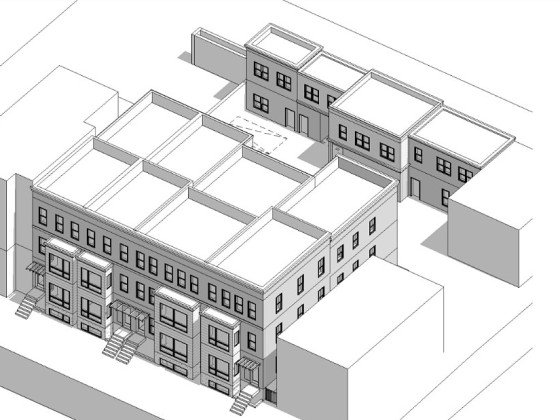
Inside a LeDroit Park rowhouse that sold for $280,000 above asking in 2015.
UrbanTurf will be doing our usual year in review of all things interesting in the world of DC real estate in a couple weeks, and to whet your appetite for that, we did a deep dive into the city’s real estate statistics for the year.
2015 was not as hot a year for the city’s real estate market as last year, but it was pretty close. The city saw moderate price and sales increases across the board, and homes continued to sell quickly even as inventory struggled to get back to “healthy” levels.
See our segmented rundown below.
story continues below
loading...story continues above
Prices
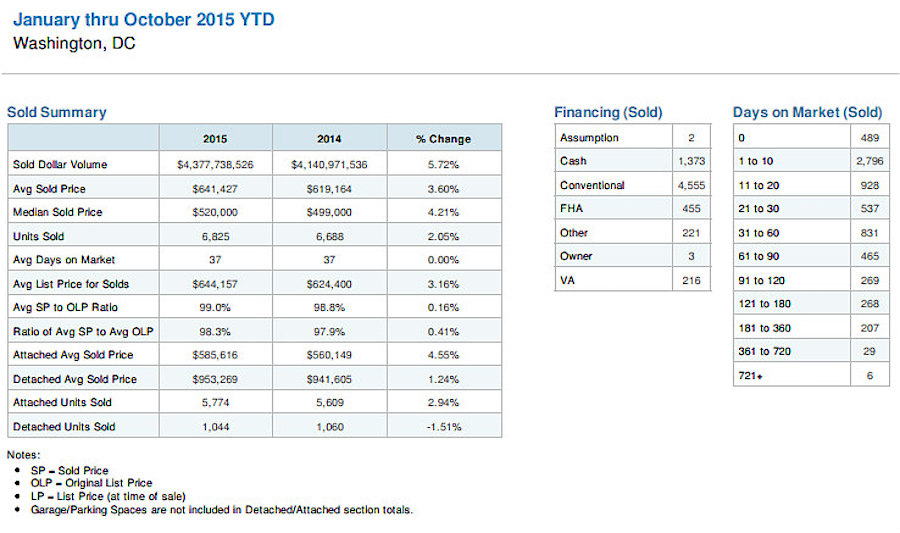
The median sales price for homes in DC rose about 4 percent this year, to $520,000 from $499,000. The average list price for a home increased 3 percent to $644,000 while the average sales price for a detached home inched up slightly to $953,269.
A closer look at property segments reveals that average condo prices increased about 3 percent from $475,000 to $490,000. Prices rose moderately across the board for other property types with two exceptions: detached homes with four bedrooms or more saw prices drop 3.8 percent and detached homes with two-bedrooms, a relatively small property segment, saw average prices pop 41 percent.
Click to enlarge
Days on Market
The average time that homes in the city spent on the market in 2015 was 37 days, the exact same as 2014. In contrast, 48 percent of the homes sold so far in 2015 did so in ten days or less.
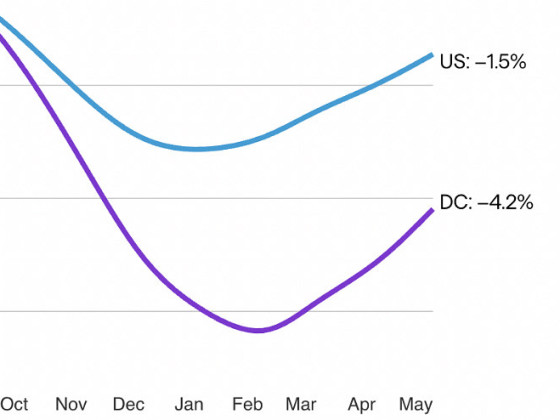
Months of Supply
The inventory of homes for sale in the District was below two months for virtually all of 2015, rising only above the two-month level in September and October. 2014 experienced a similar scarcity of inventory, with just four months of supply above the two-month level.
Sales Volume
Total dollar volume of homes sold in DC in 2015 increased to $4.37 billion from $4.14 billion last year, a 5.7 percent increase. The total number of units sold rose two percent, from 6,688 listings to 6,825 listings.
A snapshot of neighborhood-level statistics:
- The Neighborhood with the Highest Median Sales Price: Berkley, which runs along Foxhall Road in upper NW, where the median sales price for the year was $1.5 million.
- The Neighborhood Where Homes Frequently Fetched Above List Price: LeDroit Park, where the average sales price to original list price ratio was 103 percent.
- The Neighborhood Where Homes Are Selling the Fastest: In North Cleveland Park, homes sold, on median, in five days.
- The Neighborhood With the Highest Price Per Square Foot: $793 in Georgetown
See other articles related to: dc home and condo prices, dc housing inventory
This article originally published at https://dc.urbanturf.com/articles/blog/dc_real_estate_by_the_numbers_in_2015/10650.


UrbanTurf Listings showcases the DC metro area's best properties available for sale.
Most Popular... This Week • Last 30 Days • Ever
A new report shows that apartment rents in the DC region have fallen over the past ye... read »

Redbrick LMD has filed plans for a roughly 160-room hotel immediately adjacent to the... read »
On the heels of a new zoning regulation expanding alley housing around DC, a new resi... read »
The DC Office of the Attorney General (OAG) said Tuesday that a lawsuit filed against... read »
Ballston has long been one of the more active redevelopment corridors in the DC area,... read »


DC Real Estate Guides
Short guides to navigating the DC-area real estate market
We've collected all our helpful guides for buying, selling and renting in and around Washington, DC in one place. Start browsing below!
First-Timer Primers
Intro guides for first-time home buyers
Unique Spaces
Awesome and unusual real estate from across the DC Metro