What's Hot: 110-Unit Condo Project Planned in Alexandria Coming Into Focus | DC's Most Anticipated Restaurant To Open Its Doors
 28 Million Square Feet: DC Development in 2019, By the Numbers
✉️ Want to forward this article? Click here.
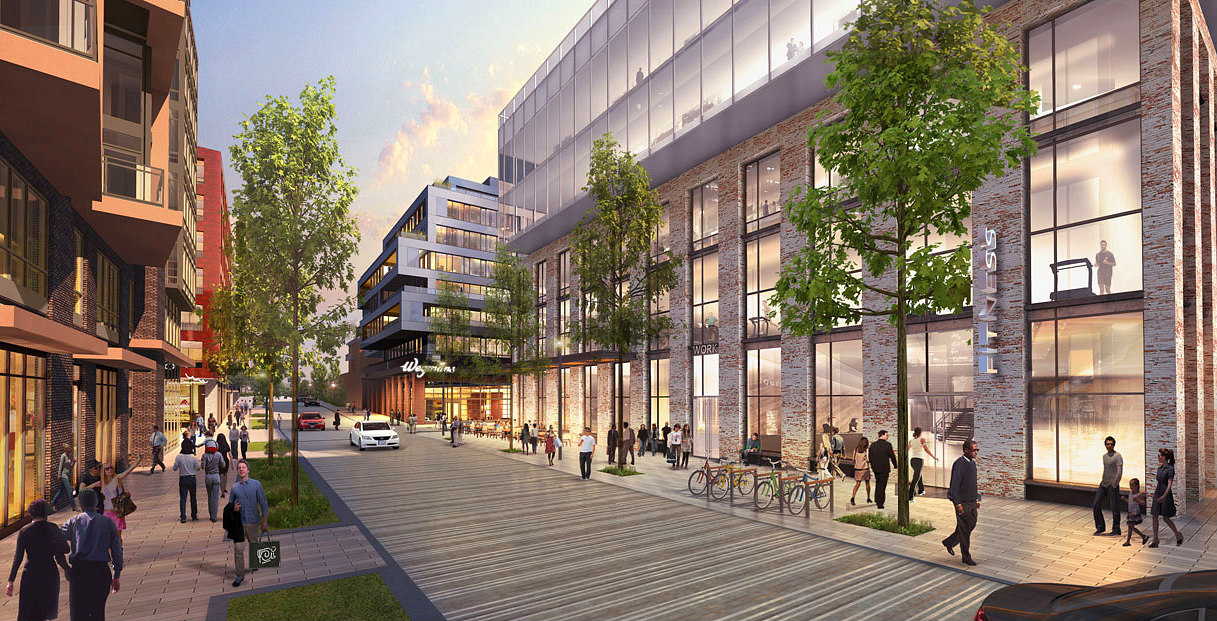
The Washington DC Economic Partnership hosted its annual meeting today, so we decided to take a look at their newly-released annual report and pick out some of the most interesting statistics when it comes to development in the city this year.
story continues below
loading...story continues above
- $82,381 -- The median income for DC households, a 35 percent increase compared to 2010. By 2024, median income is projected to be $94,570.
- 19,725 -- The number of 25-39 year-olds that moved to DC between 2015 and 2018.
- 28.4 million -- The number of square feet of development under construction in DC. Of that, 16.6 million square feet is residential, equating to 89 projects and 17,088 units.
- $15.6 billion -- Taxable retail and restaurant sales in 2018, up 9 percent since 2017.
- 42 -- The number of projects totaling 9.1 million square feet that delivered in the District as of August this year.
- 10,912 -- The number of Class A apartments that delivered in the DC area between June 2018 and June 2019.
- 4,861 -- The number of Class A apartments that delivered in DC between June 2018 and June 2019.
- $2,487 -- The effective monthly rent for Class A apartments in DC.
- 60% -- The percentage of units to deliver in DC over the last decade that were one-bedrooms.
This article originally published at https://dc.urbanturf.com/articles/blog/dc-development-in-2019-by-the-numbers/16137.
Most Popular... This Week • Last 30 Days • Ever

A look at the closing costs that homebuyers pay at the closing table.... read »
3331 N Street NW sold in an off-market transaction on Thursday for nearly $12 million... read »
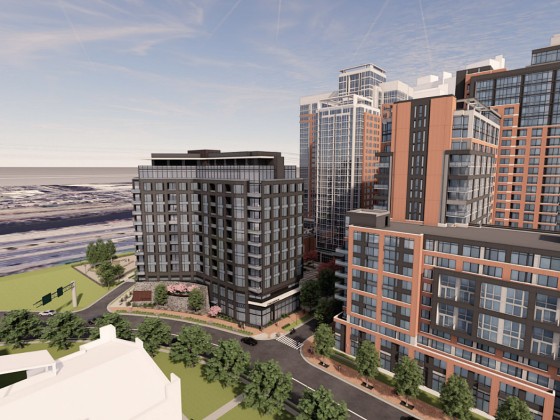
Paradigm Development Company has plans in the works to build a 12-story, 110-unit con... read »
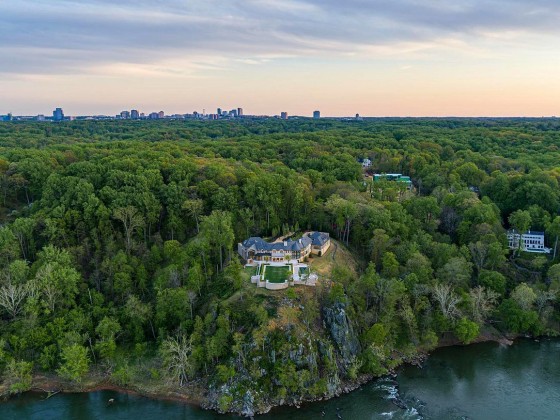
The most expensive home to sell in the DC region in years closed on Halloween for an ... read »
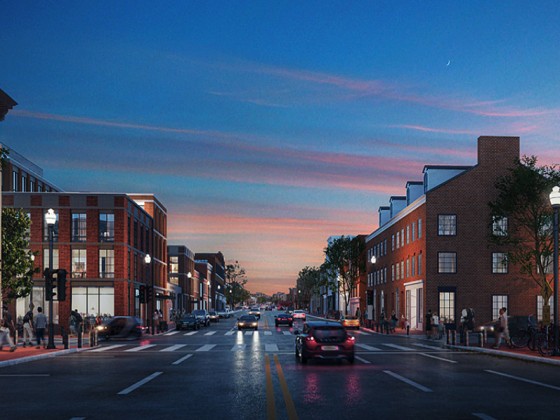
The development group behind the hotel has submitted for permit review with DC's Hist... read »
- How Do Closing Costs Work in DC
- Georgetown Home Sells For $11.8 Million, Priciest Sale in DC In 2024
- 110-Unit Condo Project Planned in Alexandria Coming Into Focus
- The Cliffs in McLean Sells For $25.5 Million, Highest Home Sale In DC Area In Years
- Georgetown Hotel That Is Partnering With Jose Andres Looks To Move Forward
DC Real Estate Guides
Short guides to navigating the DC-area real estate market
We've collected all our helpful guides for buying, selling and renting in and around Washington, DC in one place. Start browsing below!
First-Timer Primers
Intro guides for first-time home buyers
Unique Spaces
Awesome and unusual real estate from across the DC Metro


