What's Hot: Douglas Development Files PUD For Large Warehouse At New City Site Along New York Avenue
 28 Million Square Feet: DC Development in 2019, By the Numbers
✉️ Want to forward this article? Click here.

The Washington DC Economic Partnership hosted its annual meeting today, so we decided to take a look at their newly-released annual report and pick out some of the most interesting statistics when it comes to development in the city this year.
story continues below
loading...story continues above
- $82,381 -- The median income for DC households, a 35 percent increase compared to 2010. By 2024, median income is projected to be $94,570.
- 19,725 -- The number of 25-39 year-olds that moved to DC between 2015 and 2018.
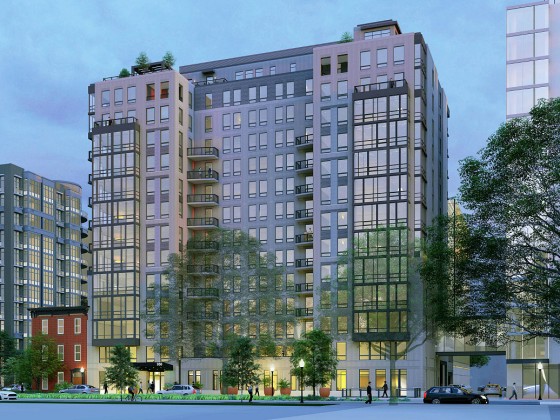
- 28.4 million -- The number of square feet of development under construction in DC. Of that, 16.6 million square feet is residential, equating to 89 projects and 17,088 units.
- $15.6 billion -- Taxable retail and restaurant sales in 2018, up 9 percent since 2017.
- 42 -- The number of projects totaling 9.1 million square feet that delivered in the District as of August this year.
- 10,912 -- The number of Class A apartments that delivered in the DC area between June 2018 and June 2019.
- 4,861 -- The number of Class A apartments that delivered in DC between June 2018 and June 2019.
- $2,487 -- The effective monthly rent for Class A apartments in DC.
- 60% -- The percentage of units to deliver in DC over the last decade that were one-bedrooms.
This article originally published at https://dc.urbanturf.com/articles/blog/dc-development-in-2019-by-the-numbers/16137.


UrbanTurf Listings showcases the DC metro area's best properties available for sale.

Most Popular... This Week • Last 30 Days • Ever

When you buy a home in the District, you will have to pay property taxes along with y... read »
The largest condominium building in downtown DC in recent memory is currently under c... read »

The plan to convert a Dupont Circle office building into a residential development ap... read »
The Rivière includes just 20 homes located on the eastern banks of the Anacostia Riv... read »

Why Tyra Banks is serving ice cream in DC; a bike shop/record store opens in Adams Mo... read »


DC Real Estate Guides
Short guides to navigating the DC-area real estate market
We've collected all our helpful guides for buying, selling and renting in and around Washington, DC in one place. Start browsing below!
First-Timer Primers
Intro guides for first-time home buyers
Unique Spaces
Awesome and unusual real estate from across the DC Metro