 10.4 Million Square Feet: An Accounting of DC's Development Pipeline
✉️ Want to forward this article? Click here.
In light of the Washington DC Economic Partnership hosting its annual meeting today, UrbanTurf went through the accompanying report and selected some of the most interesting statistics and highlights about residential development in the city.
story continues below
loading...story continues above
Here is a quick rundown:
- DC’s population now stands at 681,170, a 12.6 percent increase since 2010.
- As of August, 55 projects had delivered in DC in 2017, totalling 6.7 million square feet. An additional 52 projects were still under construction at that time and are slated to deliver an additional 8.8 million square feet of development to the city by the end of the year.
- There are 91 residential developments with a total of 15,860 units currently under construction.
- Approximately 10.4 million square feet of development broke ground in 2017. The projects that broke ground this year have an average size of 179,000 square feet, the largest observed by WDCEP in the 16 years the annual development census has been released.
- The most active developer in the city since 2012 is Douglas Development, with 14 projects completed, 6 under construction and 9 in the pipeline. JBG Smith is a close second with 27 projects (including 12 in the pipeline). Based solely on square footage, JBG Smith is by far the most active developer in the city with 10.2 million square feet of development since 2012.
- During the first three quarters of 2017, 5,171 rental apartments delivered in DC while 5,414 apartments were absorbed.
- Residential construction starts citywide were below average this year, with 2,854 units beginning construction. While this is largely due to high construction costs, 13 projects totalling 3,986 residential units were stalled this year by legal challenges in the DC Court of Appeals. Consequently, multifamily residential deliveries will be lower over the next three years, with 4,822 units projected to deliver in 2018, 4,737 in 2019 and 1,473 in 2020. This will eventually benefit developers by allowing existing developments time to lease up and increasing rent growth by an expected 3.5 percent annually over the next three years.
- In Anacostia, 1,223 residential units delivered between 2001 and August 2017; now, over 6.1 million square feet of development is either currently under construction or in the pipeline, including an additional 2,967 residential units.
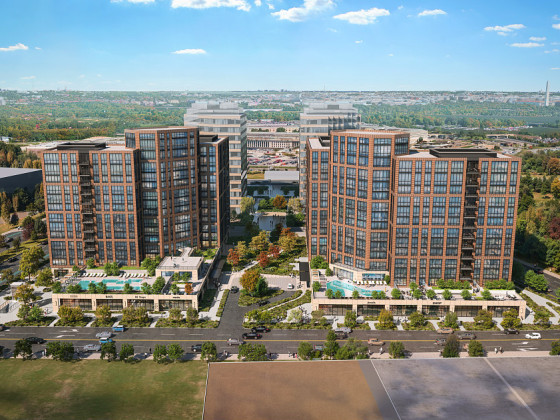
- While the first phase of The Wharf development was one of the largest projects to deliver in the city this year, the 1.5-mile stretch of land that encompasses the Capitol Riverfront and Southwest Waterfront still has over 50 projects in the pipeline, totalling 10,000 residential units, 4.7 million square feet of office space and 700,000 square feet of retail.
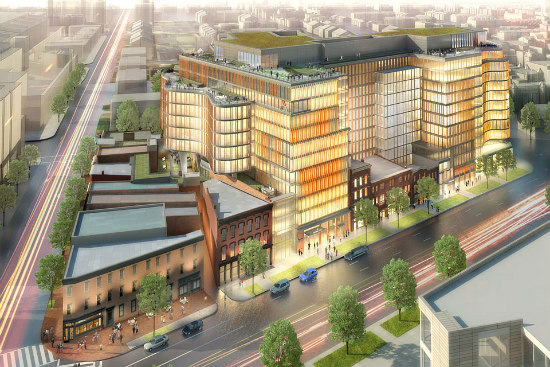
- The NoMa and Union Market area shows no signs of slowing down, with over 34 million square feet of development on the boards, including 9 million square feet of office space, 1 million square feet of retail and 16,500 new residential units.
- Foggy Bottom has been supplanted by the Downtown/Logan Circle neighborhood for highest effective market rent, at $2,506. Anacostia/Northeast still has the lowest effective market rent at $1,665.
See other articles related to: development, pipeline, wdcep
This article originally published at https://dc.urbanturf.com/articles/blog/10.4_million_square_feet_an_accounting_of_dcs_development_pipeline/13356.


UrbanTurf Listings showcases the DC metro area's best properties available for sale.

Most Popular... This Week • Last 30 Days • Ever

UrbanTurf is re-running its primer on property taxes which outlines a few things that... read »

The wait for Eataly in the DC area has been a long one.... read »
The Arlington County Board signed off on a pair of transformative residential project... read »
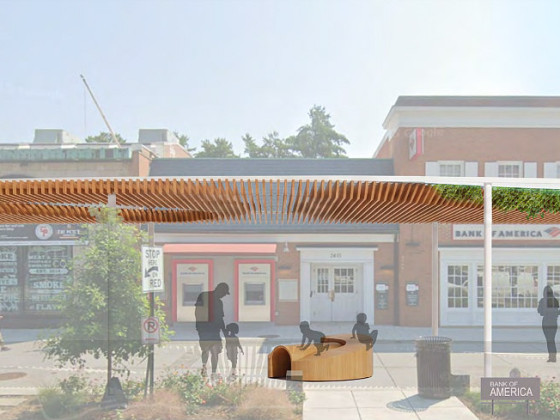
The plan to add a shade structure along the Cleveland Park commercial corridor has re... read »

DOGE doesn't seem dead yet; Monument buys Inn of Rosslyn; and Costco gas stations are... read »


DC Real Estate Guides
Short guides to navigating the DC-area real estate market
We've collected all our helpful guides for buying, selling and renting in and around Washington, DC in one place. Start browsing below!
First-Timer Primers
Intro guides for first-time home buyers
Unique Spaces
Awesome and unusual real estate from across the DC Metro