What's Hot: Did January Mark The Bottom For The DC-Area Housing Market? | The Roller Coaster Development Scene In Tenleytown and AU Park
 The Must Use Tool for DC Home Buyers
✉️ Want to forward this article? Click here.
Doing your homework when it comes to crime is one of the more crucial steps you should take before making the final decision on where to buy a home, particularly in a city like DC where it seems every other neighborhood is being labeled “transitional”.
Fortunately for those looking within the DC borders, there is a tool that makes this step fairly easy. The DC Crime Map provides users with crime stats within the vicinity of any address in the city limits, and allows users to choose a radius around that location as well as a specific time period to help define the search. For instance, users can search for crimes that occurred within 250, 500 or 1,000 feet of a given property over the course of the last few months, the last year, or just during 2009.
What pops up after the parameters are defined is a complete breakdown of violent crimes and property crimes for a given period as well as a complementary map that provides the exact locations of those crimes. A spreadsheet is also provided that also allows users to compare statistics from the chosen search with past statistics. For instance, if you search for crimes committed in the past year you’ll be able to compare those stats with crimes committed during the year prior to that, along with a calculation of the net change that provides a nice visual of the direction a neighborhood may be heading.
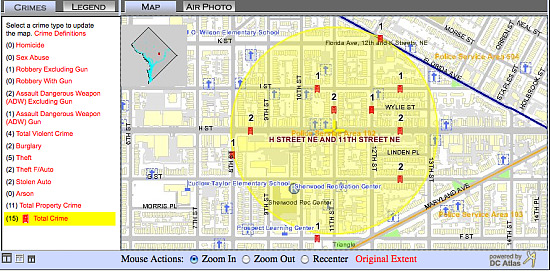
Crime activity around 11th and H Street NE
Prospective home buyers could spend endless hours playing with the map functions, comparing trends around their current home to places they have lived in the past, as well as comparing the neighborhoods where they may potentially purchase.
The faint of heart are well advised to avoid the mapping function, particularly for violent crime, as it may result in never leaving home again. For instance, this author found that in the past two months there have been seven violent crimes and 16 property crimes within 1,000 feet of his home (one of those took place at his residence when a shoddy Trek bicycle was absconded in March). Despite the unsettling statistics, the stats proved that the map is updated frequently. Not long after the bike was stolen, the crime was registered on the site with the location pinned.
Providing a meaningful breakdown between violent and property crime is obviously a useful metric for prospective buyers to determine their tolerance for a rough neighborhood, or their preferences in urban pioneering. But like any tool, the DC Crime Map requires some fine tuning to paint an accurate picture. Users are encouraged to view the maps associated with the numbers to see if crimes are clustered in one area or spread evenly through a neighborhood. Otherwise, one could inaccurately draw the conclusion that there is a lot of crime occurring in an area that just has a few rough spots.
See other articles related to: editors choice
This article originally published at https://dc.urbanturf.com/articles/blog/the_must_use_tool_for_dc_home_buyers/1987.
Most Popular... This Week • Last 30 Days • Ever

Lincoln-Westmoreland Housing is moving forward with plans to replace an aging Shaw af... read »

The small handful of projects in the pipeline are either moving full steam ahead, get... read »
A report out today finds early signs that the spring could be a busy market.... read »

A potential collapse on 14th Street; Zuckerberg pays big in Florida; and how the mark... read »

A potential innovation district in Arlington; an LA coffee chain to DC; and the end o... read »
DC Real Estate Guides
Short guides to navigating the DC-area real estate market
We've collected all our helpful guides for buying, selling and renting in and around Washington, DC in one place. Start browsing below!
First-Timer Primers
Intro guides for first-time home buyers
Unique Spaces
Awesome and unusual real estate from across the DC Metro


