What's Hot: Did January Mark The Bottom For The DC-Area Housing Market? | The Roller Coaster Development Scene In Tenleytown and AU Park
 The Demand Metric That Defines DC's Housing Market Right Now
✉️ Want to forward this article? Click here.
In May, there were 1,427 active listings on the market in DC. That number amounts to a mere 1.95 months of inventory, well below the six-month benchmark for a balanced housing market and an indication of the continued effect that the pandemic is having on the market.
While the number of new listings coming on the market each month directly affects the city’s inventory, a little known metric is an equally critical indicator of the supply of homes for sale and homebuyer demand.
story continues below
loading...story continues above
Contract ratio compares the total number of homes under contract in a given period to the overall number of active listings. A higher ratio signifies an increase in contracts compared to supply. For example, a ratio of 1.2 means there are 1.2 listings under contract for every listing that is active.
The imbalance between high homebuyer demand in DC and the short supply of homes for sale is best illustrated in contract ratio. Approximately 40 percent of DC neighborhoods had a contract ratio above 1.0 last month, one of the highest levels on record. In Riggs Park and Brentwood, the ratio came in at 3.0 while in Deanwood, North Cleveland Park, Michigan Park and Colonial Village, it was 2.0 or higher. There were another 25 neighborhoods in the city where the contract ratio exceeded 1.0.
UrbanTurf will continue to monitor contract ratio in the coming months to see if the city maintains the supply and demand imbalance.
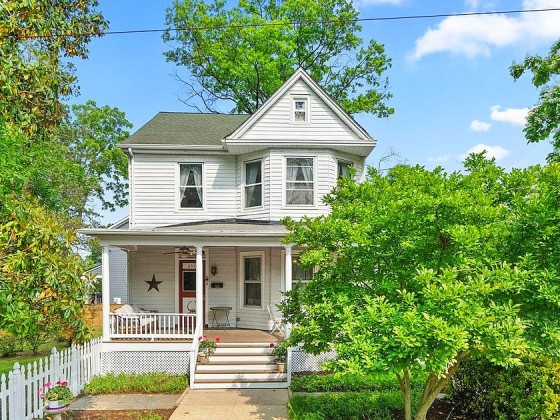
The thumbnail image is of a home that sold in North Cleveland Park in May.
See other articles related to: contract ratio
This article originally published at https://dc.urbanturf.com/articles/blog/the-demand-metric-that-defines-dcs-housing-market/16980.
Most Popular... This Week • Last 30 Days • Ever
As mortgage rates have more than doubled from their historic lows over the last coupl... read »

The small handful of projects in the pipeline are either moving full steam ahead, get... read »
Lincoln-Westmoreland Housing is moving forward with plans to replace an aging Shaw af... read »

The longtime political strategist and pollster who has advised everyone from Presiden... read »
A report out today finds early signs that the spring could be a busy market.... read »
DC Real Estate Guides
Short guides to navigating the DC-area real estate market
We've collected all our helpful guides for buying, selling and renting in and around Washington, DC in one place. Start browsing below!
First-Timer Primers
Intro guides for first-time home buyers
Unique Spaces
Awesome and unusual real estate from across the DC Metro


