 The 8-Year Path of DC Real Estate in Three Charts
✉️ Want to forward this article? Click here.
For months last year when we reported on the local housing market, the term “record-breaking” was used frequently to describe everything from home prices to home sales. And a look back at statistics from 2016, reveal that the DC housing market, for the year, set records in everything from home price to home sales.
UrbanTurf picked out three charts that are indicative of the change in the DC housing market since the beginning of 2009 that also help put the climate and performance of the market last year in perspective.
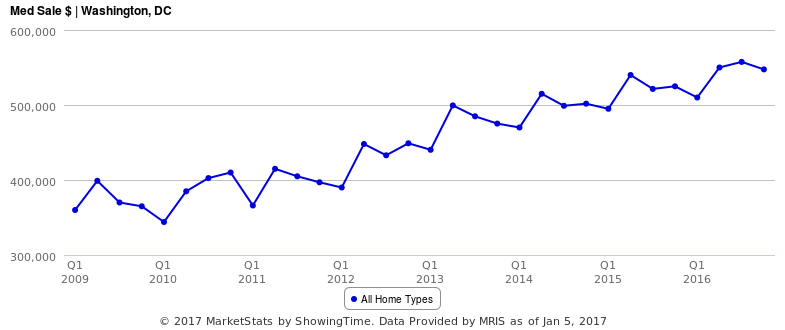
Median Sales Price. Click to enlarge.
Last year, the median home sales price in DC was $545,000, the highest level on record for the city. The median price represents a 47 percent increase from the first quarter of 2009 (31 percent when adjusted for inflation), when the price level sat at $369,900. As expected given the rise in prices, sales volume in the District in 2016, at over $5.5 billion, was the highest on record.
story continues below
loading...story continues above
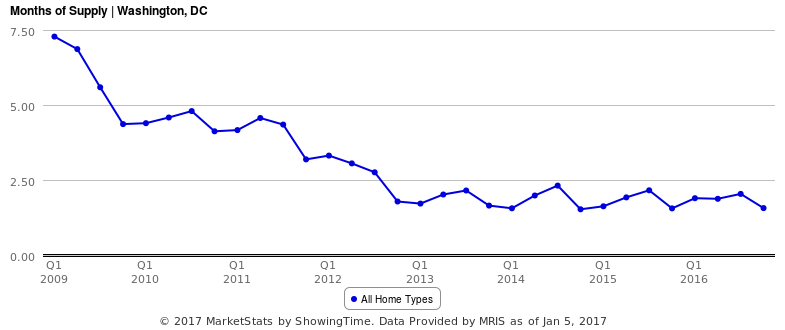
Months of Supply. Click to enlarge.
The inventory of homes for sale has been the headline for the DC housing market for quite awhile, and a look at housing supply reveals just how acute the shortage has become. In the first quarter of 2009, there was a seven-month supply of homes for sale in DC. (The benchmark of a balanced housing market is usually a six-month supply.) In the fourth quarter of 2016, that supply had dropped to a mere 1.5 months, and there is no indication that will change anytime soon.
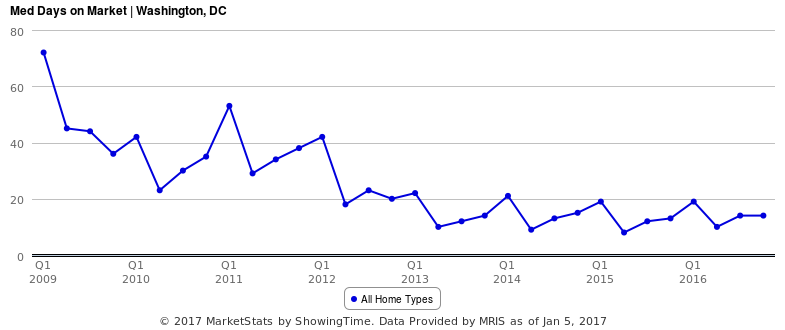
Days on Market. Click to enlarge.
Perhaps one of the reasons that there is an inventory shortage in DC is that homes are not staying on the market very long. Back in the first quarter of 2009, the median days on market statistic for the city was 72 days. In the fourth quarter of last year, that metric had dropped to 14 days, having sat below three weeks since 2013.
This article originally published at https://dc.urbanturf.com/articles/blog/a_decade_in_dc_real_estate_in_three_charts/12093.


UrbanTurf Listings showcases the DC metro area's best properties available for sale.

Most Popular... This Week • Last 30 Days • Ever
EYA and the Washington Metropolitan Area Transit Authority have requested a two-year ... read »

While the broader DC-area housing market grapples with elevated mortgage rates and ca... read »
From the Maryland line down to the edge of downtown, a mix of office conversions, inf... read »

Close-in suburbs are seeing some of the steepest rent declines in the region, while s... read »

Dulles International Airport is slated for its biggest transformation since it opened... read »


- Rising Costs Stall 434-Unit Takoma Metro Project, Developer Seeks More Time
- The DC-Area Luxury Market Is Playing By Its Own Rules
- 1,800 Units In The Works: Connecticut Avenue's Building Boom
- Across The DC Region, Rent Growth Is Splitting Along The Beltway
- Trump Administration Unveils $22 Billion Overhaul of Dulles International Airport
DC Real Estate Guides
Short guides to navigating the DC-area real estate market
We've collected all our helpful guides for buying, selling and renting in and around Washington, DC in one place. Start browsing below!
First-Timer Primers
Intro guides for first-time home buyers
Unique Spaces
Awesome and unusual real estate from across the DC Metro