 $643 a Square Foot: A Look at Downtown DC's Numbers
✉️ Want to forward this article? Click here.
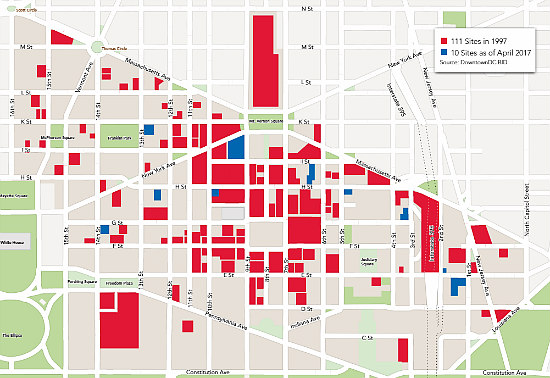
Development sites within the Downtown BID
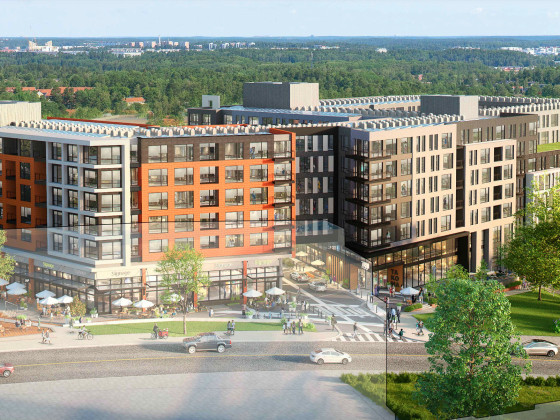
Twenty years ago, when the Downtown DC Business Improvement District (BID) was formed, there were 111 surface parking lots and redevelopment sites within the district’s boundaries. Now, only ten of those surface lots remain, indicating the abundance of new construction within the 138-block area.
The BID recently released a report on the status of demographics and development in that area of the city; below are some of the data points the report revealed.
- The downtown BID is DC’s largest center of employment, containing 24 percent of the city’s jobs. However, at least 1.5 million square feet of office space is expected to be vacated within the next few years.
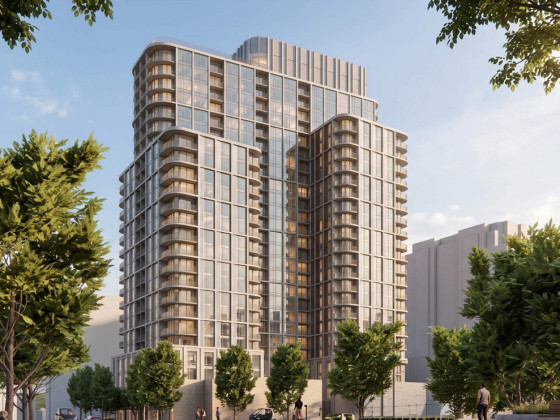
- The office market within the BID has experienced negative absorption between 2015 and 2016, with the vacancy rate increasing from 12 to 13 percent. Despite this, office space continues to be developed and rents per square foot continue to increase within the BID. In fact, the majority of large-scale development that has broken ground in the area since CityCenterDC has been office, retail and hotel.
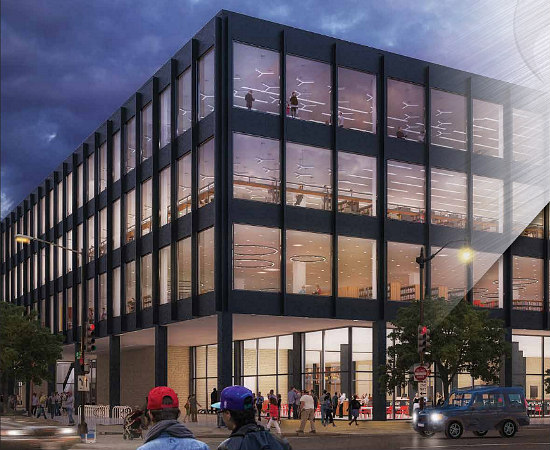
Rendering of the planned MLK Library revitalization
story continues below
loading...story continues above
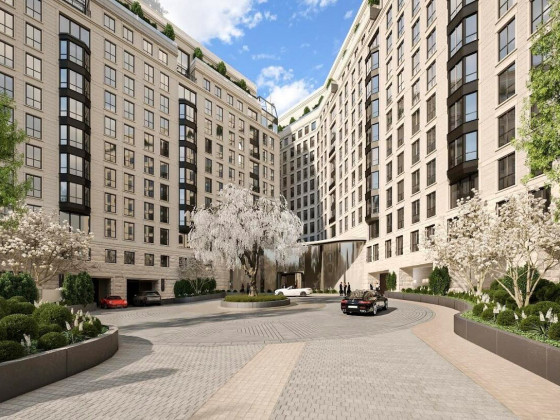
- Class A high-rise apartment rents reached a new record last year, increasing two percent annually to hit an average of $3.29 per square foot. “No new residential units were delivered in 2016 for the second consecutive year,” the report notes.
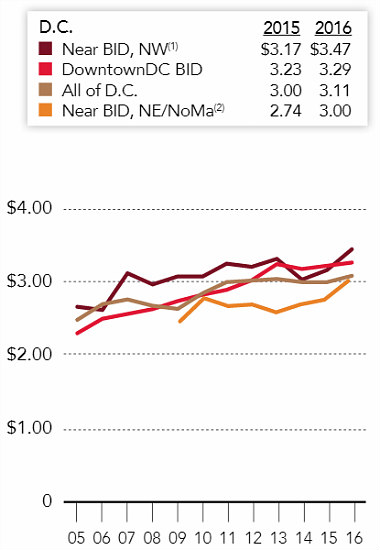
Class A effective rents per square foot
- The apartment vacancy rate also decreased to 2.9 percent, with 9,831 residents in the BID occupying roughly 7,100 units (1.5 people per unit).
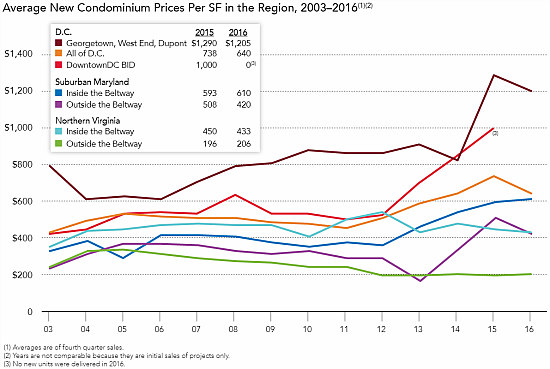
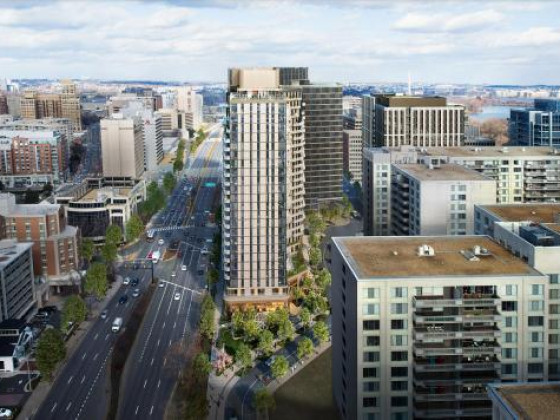
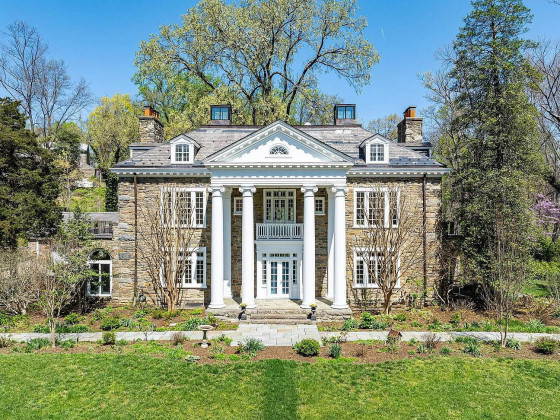
New condo prices per square foot
- The prices of resale condominiums also hit a record last year, at $643 per square foot; resales at the newer CityCenter development average $950-$1,100 per square foot.
- About 35 percent of residents were 30 years old or younger and the average annual household income was $131,730 in 2016.
This article originally published at https://dc.urbanturf.com/articles/blog/643_a_square_foot_a_look_at_downtown_dcs_numbers/12485.


UrbanTurf Listings showcases the DC metro area's best properties available for sale.

Most Popular... This Week • Last 30 Days • Ever
EYA and the Washington Metropolitan Area Transit Authority have requested a two-year ... read »

While the broader DC-area housing market grapples with elevated mortgage rates and ca... read »
From the Maryland line down to the edge of downtown, a mix of office conversions, inf... read »

Dulles International Airport is slated for its biggest transformation since it opened... read »
Close-in suburbs are seeing some of the steepest rent declines in the region, while s... read »


- Rising Costs Stall 434-Unit Takoma Metro Project, Developer Seeks More Time
- The DC-Area Luxury Market Is Playing By Its Own Rules
- 1,800 Units In The Works: Connecticut Avenue's Building Boom
- Trump Administration Unveils $22 Billion Overhaul of Dulles International Airport
- Across The DC Region, Rent Growth Is Splitting Along The Beltway
DC Real Estate Guides
Short guides to navigating the DC-area real estate market
We've collected all our helpful guides for buying, selling and renting in and around Washington, DC in one place. Start browsing below!
First-Timer Primers
Intro guides for first-time home buyers
Unique Spaces
Awesome and unusual real estate from across the DC Metro