What's Hot: What Is Happening With DC-Area Rents In 2026?
 The Two DC Opportunity Zones Where Home Prices Went Up at Least 50%
✉️ Want to forward this article? Click here.
Over the past year, the third since Opportunity Zones first debuted, home prices have gone up in 75% of the so-designated census tracts nationwide.
This insight comes courtesy of the latest Opportunity Zones (OZ) report from ATTOM, which also says that year-over-year median prices went up by at least 15% in half of the OZ tracts studied. A lot of this increase may be a byproduct of the high-demand housing market, however.
story continues below
loading...story continues above
“Values kept rising inside specially designated Opportunity Zones at around the same rate as they did in other areas even as the Coronavirus pandemic continued causing economic hardship,” Todd Teta, ATTOM chief product officer, said in the report.
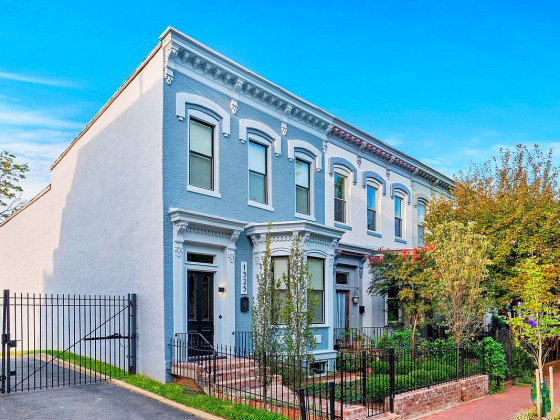
In the District, the 7603 Opportunity Zone (south of Pennsylvania Avenue SE and southeast of Alabama Avenue and Naylor Road) had the highest year-over-year price increase of 54.3%, from $159,900 in the second quarter of 2020 to $246,750 in the second quarter of 2021.
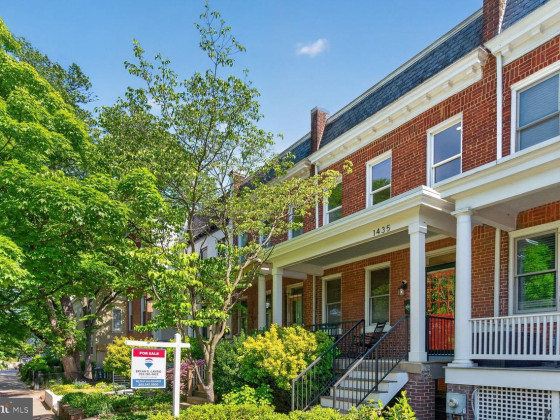
Tract 9102 (Brentwood between New York and Rhode Island Avenues, 18th Street NE and the train tracks) came in second, with prices going up by 50.1% from $433,000 to $650,000. Out of the remaining 10 OZs, six had home price growth of 10% or less year-over-year.
The report uses census tract home price data and OZ census tracts were included if there were at least five sales in the second quarter of 2021; UrbanTurf typically applies a 10-sale minimum to ensure more accurate conclusions.
See other articles related to: attom data solutions, dc home prices, home prices, opportunity zones
This article originally published at https://dc.urbanturf.com/articles/blog/the-two-dc-opportunity-zones-where-home-prices-went-up-at-least-50/18601.


UrbanTurf Listings showcases the DC metro area's best properties available for sale.

Most Popular... This Week • Last 30 Days • Ever
Janeese Lewis George appears to have won Tuesday's Democratic mayoral primary, puttin... read »

This week’s Best New Listings includes a 100-year old bungalow in Hyattsville and a... read »
The housing market got a late-spring boost in May.... read »
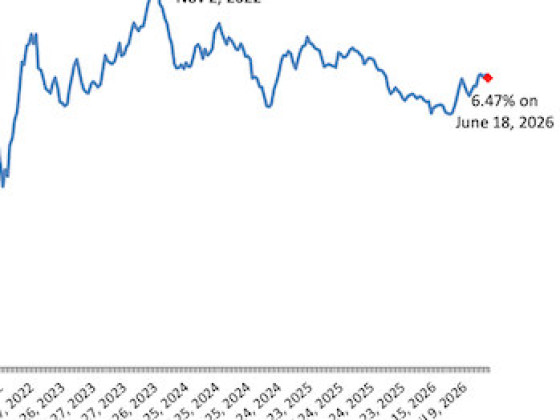
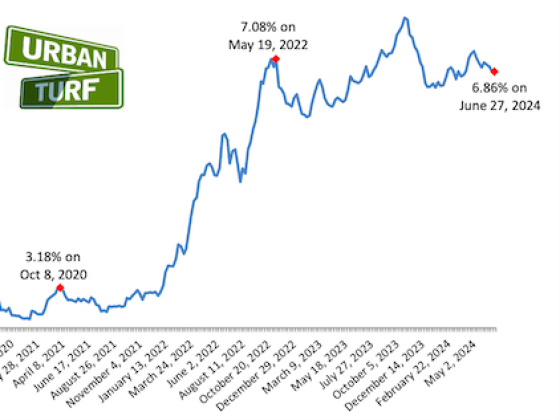
Freddie Mac reported Thursday that the 30-year fixed-rate mortgage averaged 6.47%, do... read »
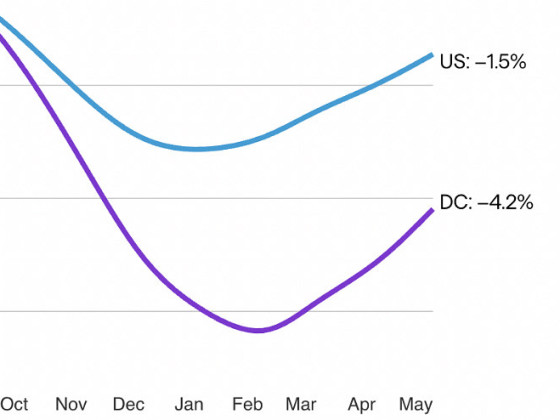
A new report shows that apartment rents in the DC region have fallen over the past ye... read »


DC Real Estate Guides
Short guides to navigating the DC-area real estate market
We've collected all our helpful guides for buying, selling and renting in and around Washington, DC in one place. Start browsing below!
First-Timer Primers
Intro guides for first-time home buyers
Unique Spaces
Awesome and unusual real estate from across the DC Metro