 25 Million Rides, 550 Stations: Nine Years In, Capital Bikeshare by the Numbers
✉️ Want to forward this article? Click here.
In 2008, DC became the first city in the country to establish a bikeshare system, laying the groundwork for what would become Capital Bikeshare. The shared transit landscape has changed considerably since then, with the system expanding into a total of seven local jurisdictions and the addition of several other bikeshare providers in DC proper, as well as the addition of on demand scooters and mopeds.
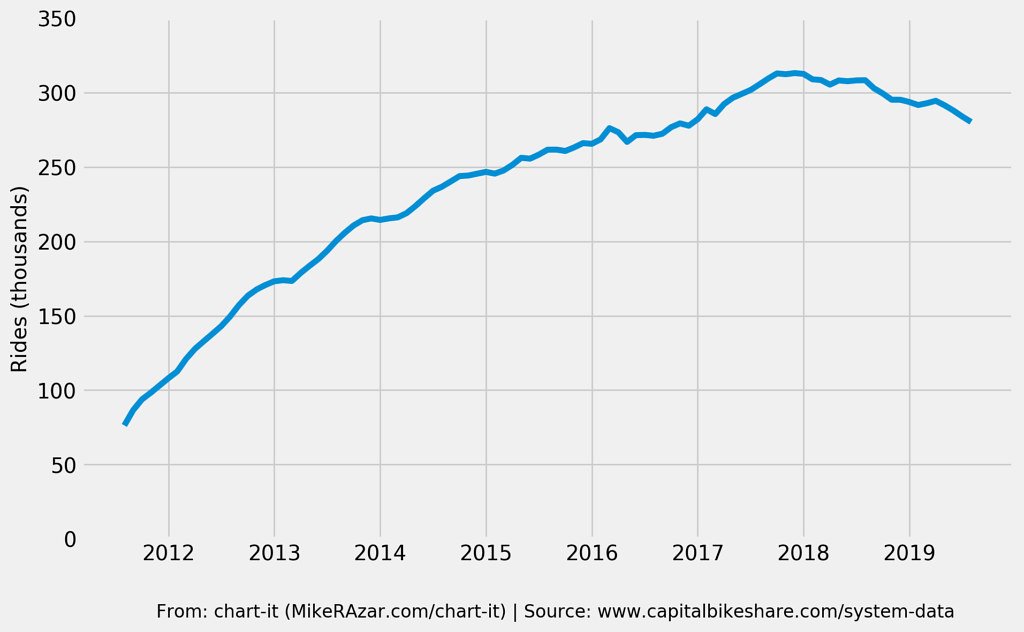
Yesterday, statistics blogger Mike Azar shared some data on Capital Bikeshare as the company celebrates over nine years in operation. Below are some of the more interesting statistics from Azar's research:
story continues below
loading...story continues above
- 25 million -- The total number of Capital Bikeshare rides since its inception.
- 310,000 -- The number of rides taken per month in 2017, at peak Capital Bikeshare usage.
- 280,000 -- The number of rides taken per month in 2019; Capital Bikeshare usage has consistently dropped since its 2017 peak, perhaps coinciding with the introduction of new dockless bikeshare providers and subsequent regulation of that industry, along with the introduction of non-bicycle shared ride operators.
- 40,000 -- The number of rides taken per month in 2019 by casual users with short term passes, comparable to this kind of ridership in 2013. This is down from nearly 85,000 casual rides taken per month in 2017. Overall, casual riders now account for less than 15 percent of total Capital Bikeshare ridership, down from a peak of 26 percent.
- 9-10 minutes -- The average duration of a ride for registered users. For casual riders, the average duration is 23-25 minutes.
- 550 -- The number of Bikeshare stations. There were fewer than 100 in 2010.
- 5,000 -- The number of Bikeshare bicycles, with about 40 added per month. In 2010, there were fewer than 500 bicycles.
See other articles related to: bikeshare, by the numbers, capital bikeshare
This article originally published at https://dc.urbanturf.com/articles/blog/nine-years-in-capital-bikeshare-by-the-numbers/15928.


UrbanTurf Listings showcases the DC metro area's best properties available for sale.

Most Popular... This Week • Last 30 Days • Ever

UrbanTurf is re-running its primer on property taxes which outlines a few things that... read »

The wait for Eataly in the DC area has been a long one.... read »
The Arlington County Board signed off on a pair of transformative residential project... read »
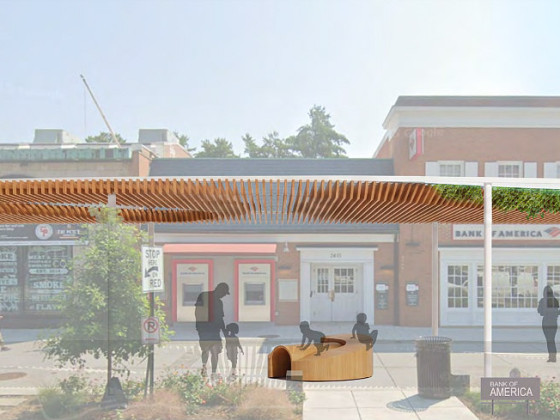
The plan to add a shade structure along the Cleveland Park commercial corridor has re... read »

At the $1 million mark, DC's market offers strikingly different products depending on... read »
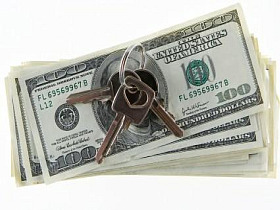


- The 5 Things To Know About DC Property Taxes
- Eataly Confirms First DC-Area Location, Landing in Tysons Corner in 2027
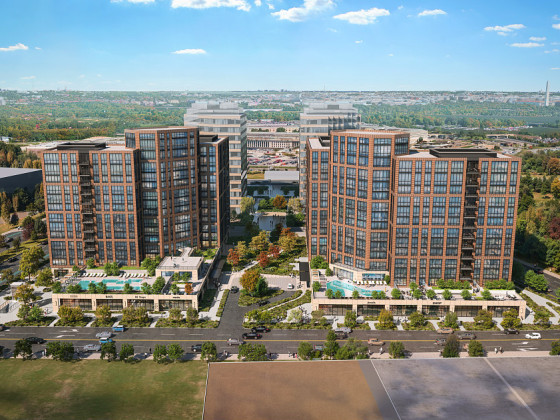
- Two Developments, 1,500 Units: Arlington Board Approves Major Rosslyn and Pentagon City Projects
- The Plan To Throw Shade On Cleveland Park Looks For Approval
- What Around $1 Million Buys In DC
DC Real Estate Guides
Short guides to navigating the DC-area real estate market
We've collected all our helpful guides for buying, selling and renting in and around Washington, DC in one place. Start browsing below!
First-Timer Primers
Intro guides for first-time home buyers
Unique Spaces
Awesome and unusual real estate from across the DC Metro