 Is the DC Area Building Enough Housing?
✉️ Want to forward this article? Click here.

While a lot of attention has been given lately to whether DC is producing enough housing units to satisfy the growing demand in the region, a new report from Trulia suggests that the regional housing market is quite elastic when compared to market conditions nationwide.
Elasticity in this context is a measure of whether sufficient housing is being constructed in response to demand in a given area, which is inferred by the trajectory of housing prices. An elasticity quotient of 1.0 signifies that for every percentage increase in housing prices, an additional one percent of housing units are constructed.
Housing is a largely inelastic industry when compared to other supply-and-demand-driven sectors. In the first quarter of 2016, the nationwide housing market had an elasticity quotient of 0.17, down from 0.18 last year.
Between 1996 and 2016, the Las Vegas area had by far the most elastic housing market, with a 1.17 percent increase in the number of housing units for every percentage increase in home prices. The Raleigh-Durham-Chapel Hill area in North Carolina was a distant second, with a quotient of 0.82.
story continues below
loading...story continues above
Perhaps surprisingly, the DC area not only has a much more elastic market than the rest of the country, but also has the ninth-most elastic market among the 100 largest metropolitan areas, with a quotient of 0.59. Specifically, over the past 20 years, area housing prices have risen 132.5 percent, while the quantity of housing units has increased 78 percent. This means that for a one percent increase in housing prices, 0.59 percent more housing units were produced.
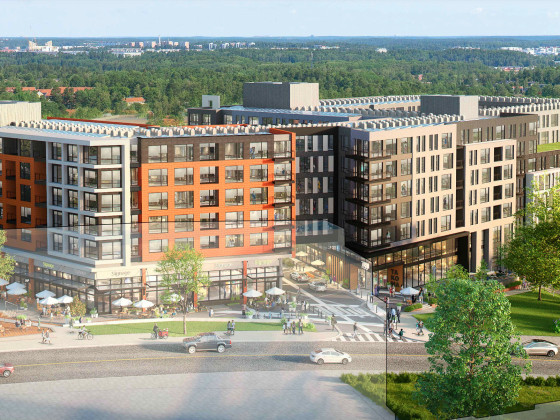
Interestingly enough, this implies that although the DC area is far from ideal in terms of constructing enough housing in response to demand — especially where affordable housing is concerned — the local market is arguably doing a decent job when compared to others across the country. A glance at the other metropolitan areas in the 90th percentile of elastic markets indicates that the DC area is one of the largest and most-dense localities on the list, with a stronger urban core than, say, Las Vegas or Atlanta.
Many of the usual suspects are counted among the ten least-elastic housing markets, including New York City (0.06) and both the San Francisco and Los Angeles-Long Beach metro areas (0.04). Low measures of elasticity are more troubling in cities which also have low vacancy rates, as healthier markets tend to experience more churn. Conversely, an elasticity quotient of 1.0 does not necessarily mean that the supply and demand of a given housing market are perfectly aligned.
According to Trulia, the factors with the strongest impact on market elasticity are the restrictions of the natural topography of an area and the bureaucratic process associated with getting development approved. This means that contrary to the increasingly popular belief that restrictive zoning regulations are detrimental to housing production, far more problematic are the length and efficiency of the approval process which accompanies such regulations.
Correction: Due to Trulia recalculating their home price data, a previous version of this article stated that homes prices in the DC area rose by 132.3 percent over the past 20 years. The actual percentage is 132.5.
See other articles related to: dc housing inventory, housing, housing market, housing market trends, trulia
This article originally published at https://dc.urbanturf.com/articles/blog/market_elasticity_as_a_measure_of_healthy_housing_supply/11485.


UrbanTurf Listings showcases the DC metro area's best properties available for sale.

Most Popular... This Week • Last 30 Days • Ever
EYA and the Washington Metropolitan Area Transit Authority have requested a two-year ... read »

While the broader DC-area housing market grapples with elevated mortgage rates and ca... read »
From the Maryland line down to the edge of downtown, a mix of office conversions, inf... read »

Bloomberg reported this week that Apple is preparing its biggest-ever push into the s... read »

UrbanTurf is once again taking its semi-regular look at the areas around DC that have... read »


- Rising Costs Stall 434-Unit Takoma Metro Project, Developer Seeks More Time
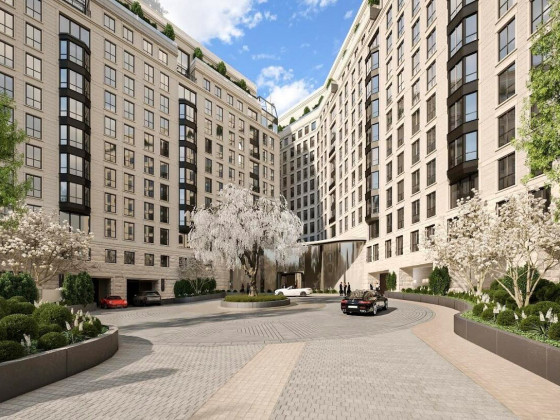
- The DC-Area Luxury Market Is Playing By Its Own Rules
- 1,800 Units In The Works: Connecticut Avenue's Building Boom
- Apple Is Building a Control Panel for Your Home
- These 7 Maryland Suburb Zip Codes Are Seeing the Biggest Price Gains in 2026
DC Real Estate Guides
Short guides to navigating the DC-area real estate market
We've collected all our helpful guides for buying, selling and renting in and around Washington, DC in one place. Start browsing below!
First-Timer Primers
Intro guides for first-time home buyers
Unique Spaces
Awesome and unusual real estate from across the DC Metro