What's Hot: Rising Costs Stall 434-Unit Takoma Metro Project | The DC-Area Luxury Market Is Playing By Its Own Rules
 DC Added Second-Most Housing Units Per Square Mile in the Past Decade
✉️ Want to forward this article? Click here.
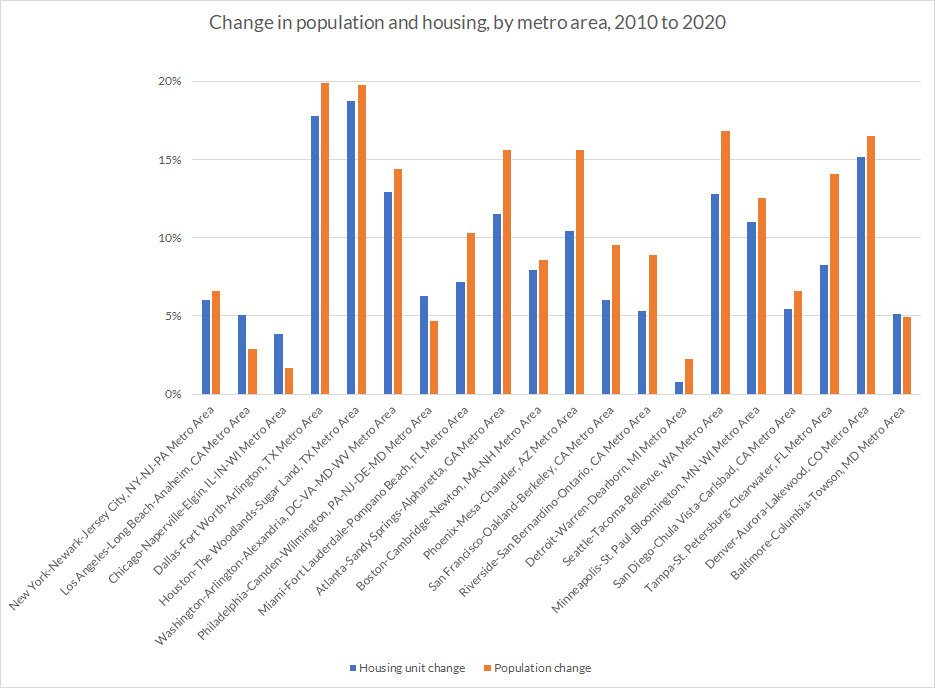
With the recent release of more-detailed Census data, the Urban Institute's Yonah Freemark tweeted some graphs that illustrate how population and housing production have changed in 20 metro areas over the past decade.
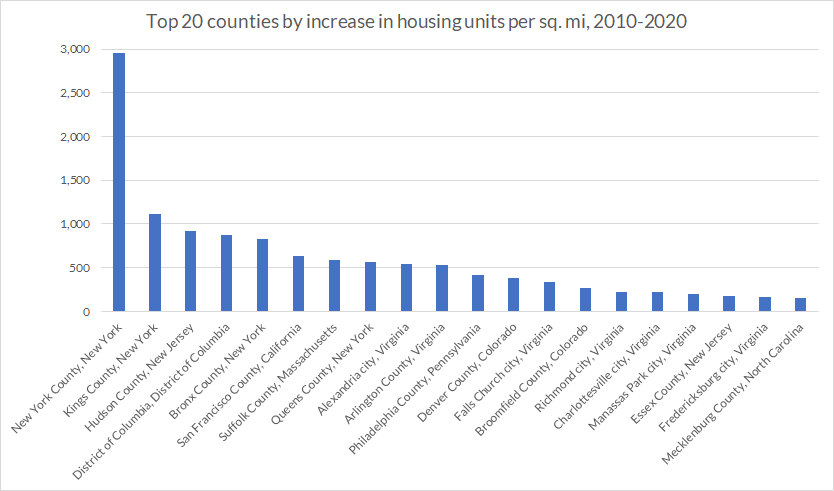
When comparing DC proper to other U.S. counties, DC had the second highest increase in housing units per square mile for anywhere outside of the New York City metro area. That amounted to an increase of about 850 units per square mile.
story continues below
loading...story continues above
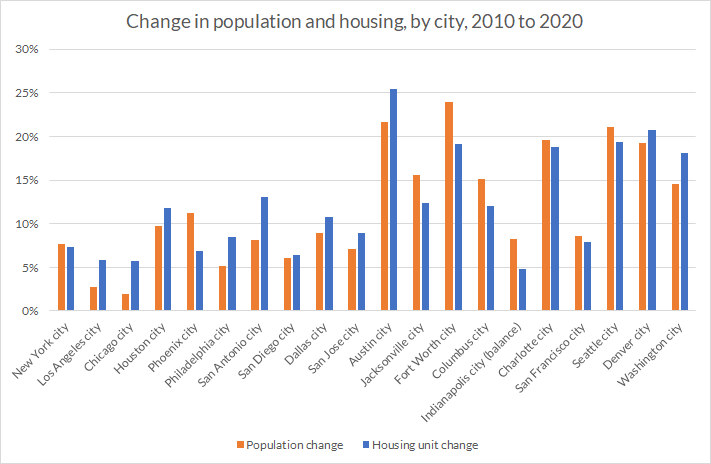
Nearly all of the metro areas studied saw population growth outpace housing production, including the DC area. In DC proper, however, housing unit production did outpace population increases over the past decade.
Out of the 20 largest metro areas, DC had the fourth-most housing production between 2010 and 2020, with an additional 286,000 units delivered. Nineteen percent of the increase in housing units in the DC area were in central city areas.
Thumbnail photo by Ted Eytan.
See other articles related to: census, housing production, population, u.s. census, us census
This article originally published at https://dc.urbanturf.com/articles/blog/dc-added-second-most-housing-units-per-square-mile-in-the-past-decade/18622.


UrbanTurf Listings showcases the DC metro area's best properties available for sale.

Most Popular... This Week • Last 30 Days • Ever

The wait for Eataly in the DC area has been a long one.... read »

EYA and the Washington Metropolitan Area Transit Authority have requested a two-year ... read »

While the broader DC-area housing market grapples with elevated mortgage rates and ca... read »

At the $1 million mark, DC's market offers strikingly different products depending on... read »

Justice Roberts selling Maryland home; bathroom danger; and what will future stadiums... read »


DC Real Estate Guides
Short guides to navigating the DC-area real estate market
We've collected all our helpful guides for buying, selling and renting in and around Washington, DC in one place. Start browsing below!
First-Timer Primers
Intro guides for first-time home buyers
Unique Spaces
Awesome and unusual real estate from across the DC Metro