 7,000 Units and Rising: DC Development in 2018 By The Numbers
✉️ Want to forward this article? Click here.
Today, the Washington DC Economic Partnership held its annual meeting, and in conjunction with the meeting, it released its 2018 development report.
Here are some of the most interesting numbers related to development across DC this year:
story continues below
loading...story continues above
- $77,686 -- The current median income for DC households, a 28 percent increase since 2010. By 2023, median income is projected to be $90,270.
- $6.2 billion -- The money invested in commercial real estate in DC in the 12 months ending September 2018. Forty-eight percent of those funds were from foreign investors.
- $163.4 million -- The investment made in real estate in DC's 25 Opportunity Zones over the past 12 months. Those OZs contain over 36 million square feet of the development in the city's pipeline.
- 26.9 million -- The number of square feet of development under construction in DC. Of that, 14.3 million square feet is residential, equating to 94 projects and 15,600 units.
- 33 -- The number of projects that JBG Smith has completed, had under construction or are in the works in DC since 2013. Douglas Development has completed 17 projects over the same timeframe, with five currently under construction and seven in the pipeline.
- 47 -- The number of projects totaling 7,651,649 square feet that delivered in the District as of August this year; an additional 63 projects are expected to deliver another 7 million square feet of development by year's end.
- 3,346 -- The number of Class A apartments that delivered in the District over the last 12 months.
- 3,682 -- The number of Class A and B market-rate apartments that were absorbed in the city over the last 12 months.
- 11,740 -- The number of market rate housing units that are expected to deliver in the District over the next two years; 80 percent of those will be in NoMa, the Southwest Waterfront and Capitol Riverfront.
- 60% -- The percentage of housing units delivered in DC from 2008 to 2018 that were one-bedrooms with and without dens. The percentages are 15.5 and 23.5 respectively for studios and two-bedrooms with and without dens.
- 5.6% -- The estimated rise in construction costs between the second quarter of 2017 and the second quarter of 2018. Next year and beyond will be crucial in determining how rising construction costs will impact the development pipeline, as most approved projects already have prices locked in.
See other articles related to: development, pipeline, washington dc economic partnership, wdcep
This article originally published at https://dc.urbanturf.com/articles/blog/700-units-and-rising-dc-development-by-the-numbers/14765.


UrbanTurf Listings showcases the DC metro area's best properties available for sale.

Most Popular... This Week • Last 30 Days • Ever

UrbanTurf is re-running its primer on property taxes which outlines a few things that... read »
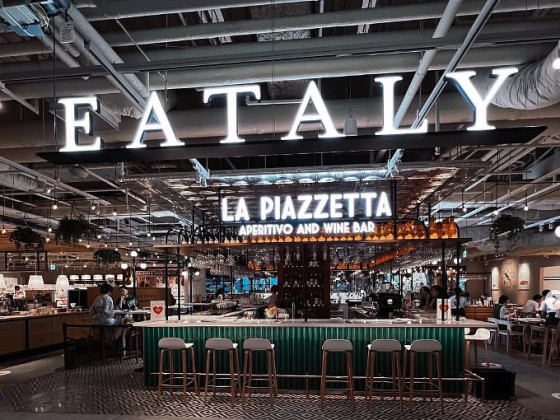
The wait for Eataly in the DC area has been a long one.... read »
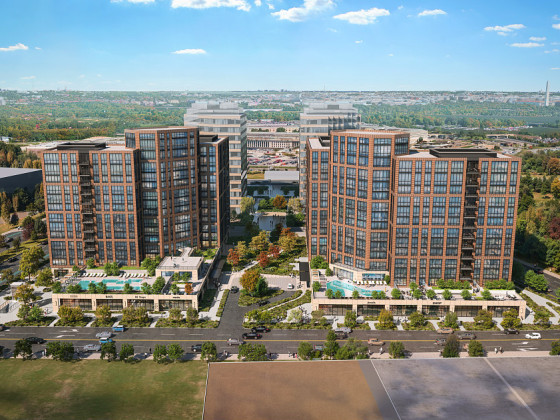
The Arlington County Board signed off on a pair of transformative residential project... read »
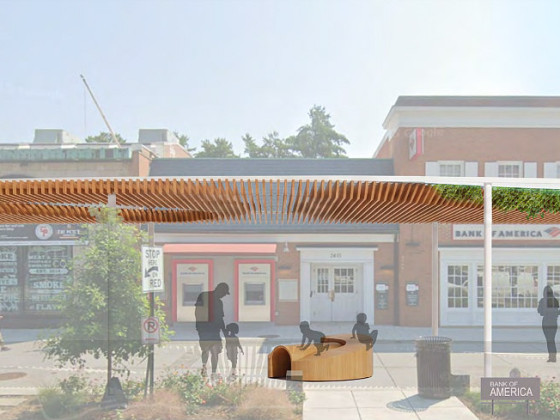
The plan to add a shade structure along the Cleveland Park commercial corridor has re... read »
DOGE doesn't seem dead yet; Monument buys Inn of Rosslyn; and Costco gas stations are... read »


DC Real Estate Guides
Short guides to navigating the DC-area real estate market
We've collected all our helpful guides for buying, selling and renting in and around Washington, DC in one place. Start browsing below!
First-Timer Primers
Intro guides for first-time home buyers
Unique Spaces
Awesome and unusual real estate from across the DC Metro