 2013 vs. 2008: Double the Sales, One Third the Inventory
✉️ Want to forward this article? Click here.
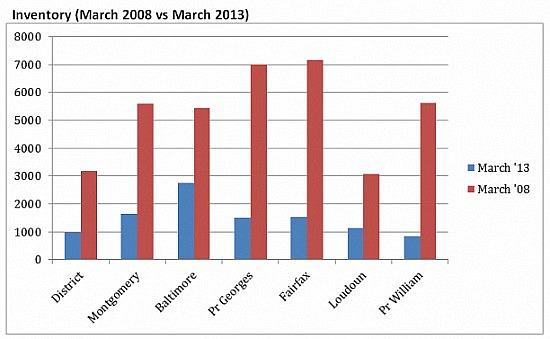
DC area inventory levels.
Two recently published charts provide a sense of just how different the DC area housing market is today versus the frenzied activity that preceded the beginning of the downturn in 2008.
The chart below, courtesy of a post on RealEstate Business Intelligence by Chris Sicks, lines up the number of contracts that were signed in March 2008 next to those in March 2013. In DC, the number of contracts signed this past March came in just below 800; compare that number to 2008 when the total number of pending sales for the month came in just above 400. A look across counties in the rest of the region showed that the contract level was higher in almost every jurisdiction in March 2013 versus the same month in 2008.
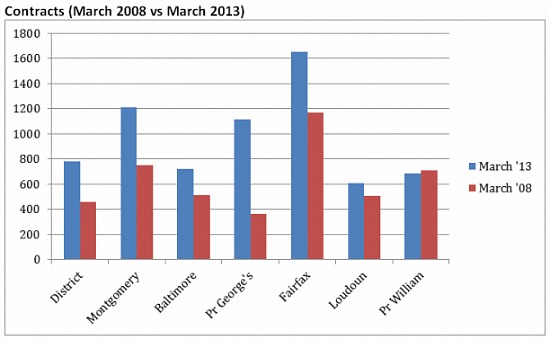
DC area contract activity.
While contracts showed a notable increase, inventory has taken the opposite trajectory. In the District, there were 1,000 homes on the market in March 2013. In March 2008, there were more than 3,000 homes listed for sale. The inventory differences are far more stark in other parts of the region. Back in 2008, there were over 7,000 homes on the market in Fairfax County. Now the inventory for the county sits at just over 1,200.
Similar Posts:
See other articles related to: housing inventory
This article originally published at https://dc.urbanturf.com/articles/blog/double_the_sales_and_one_third_the_inventory_since_2008/7024.


UrbanTurf Listings showcases the DC metro area's best properties available for sale.

Most Popular... This Week • Last 30 Days • Ever
A new report shows that apartment rents in the DC region have fallen over the past ye... read »

Redbrick LMD has filed plans for a roughly 160-room hotel immediately adjacent to the... read »
On the heels of a new zoning regulation expanding alley housing around DC, a new resi... read »

The DC Office of the Attorney General (OAG) said Tuesday that a lawsuit filed against... read »

The increasing costs of owning a home; the algae in the pool; and why rates may rise ... read »


DC Real Estate Guides
Short guides to navigating the DC-area real estate market
We've collected all our helpful guides for buying, selling and renting in and around Washington, DC in one place. Start browsing below!
First-Timer Primers
Intro guides for first-time home buyers
Unique Spaces
Awesome and unusual real estate from across the DC Metro