What's Hot: The 4 Projects in the Works Near DC's Starburst Intersection | A 153-Room Aloft Hotel Pitched For Mt. Vernon Triangle
 Market Watch: A Lot of Activity in Brookland and Michigan Park
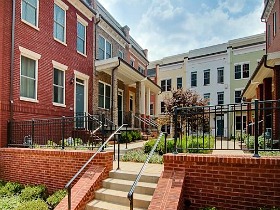
New Chancellor’s Row townhome project in 20017
Housing Market Watch is a weekly feature on UrbanTurf in which Keith Gibbons, the brains behind DCHousingPrices.com analyzes recent MRIS statistics for a specific DC area zip code to help paint a picture of the housing market in that area.
In Housing Market Watch this week, UrbanTurf looks at the DC zip code 20017, which is tucked away in northeast DC, and includes portions of the Brookland, Michigan Park and North Michigan Park neighborhoods as well as the campus of Catholic University.
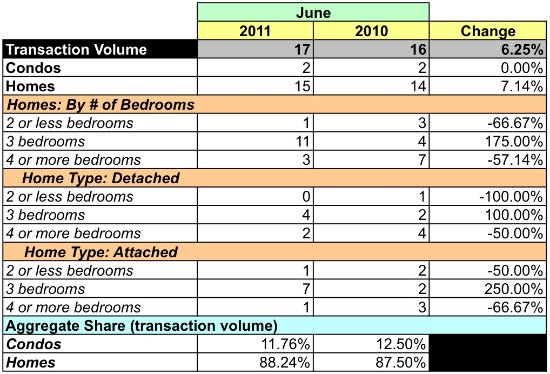
In June, 17 residential properties sold in 20017. Here is a chart providing a year-over-year comparison of sales volume, median price and average price:
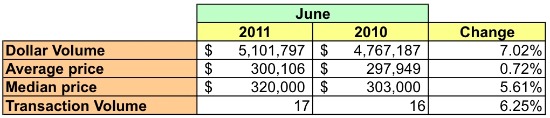
20017 Market Summary
Unit sales were up 6.25 percent in the zip code when compared to the previous June, which is somewhat peculiar given that June 2010 sales numbers across the city (as well as the country) were particularly high thanks to the federal home buyer credit. The average sales price for homes remained pretty flat, up a mere 0.72 percent, but the median price increased 5.61 percent. (Average price for a condo: $147,200; Average price for a single-family home: $320,493.) Single-family homes dominate the market in 20017, and accounted for 90 percent of the properties sold last month. Homes that sold were in the $100,000 to $500,000 range.
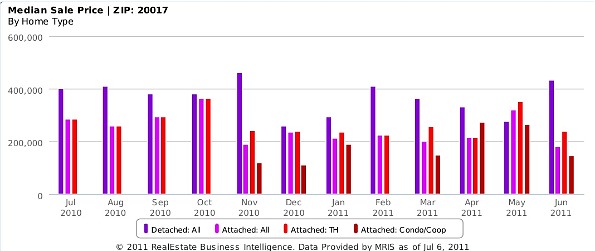
Median home sales prices in 20017 since June 2010.
There were 48 active listings in June — 10 condos and 38 houses. All of the condos were priced below $300,000, and the houses were listed for anywhere from $150,000 to $800,000. The sales pace for 20017 last month was the swiftest it has been since June 2007; 16 homes went under contract, and another 8 had contingent contracts. According to MRIS, properties in 20017 sold for 91.6 percent of their listing price last month, however the median sales price was about 26 percent lower than the rest of the city. At June’s sales pace, there’s a 5-month supply of condos and a 2.53-month supply of houses.
The data show that 20017 is not a high volume zip code; during the past twelve months it’s averaged 11 house and condo sales per month. But, it offers homes at prices significantly below the District average and June’s sales activity shows that there’s a lot of buyer interest in the area.
Below are charts that provide more detailed statistics of the market in 20017.
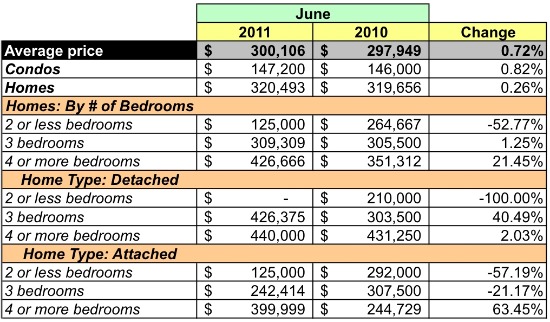
Average Sales Price
Unit Sales Volume
Similar Posts:

This article is based on custom data provided to UrbanTurf by MRIS, a developer of real estate technology and information as well as the largest multiple listing service (MLS) in the United States.
See other articles related to: brookland, catholic university, dclofts, market watch, michigan park
This article originally published at https://dc.urbanturf.com/articles/blog/market_watch_a_lot_of_activity_in_brookland_and_michigan_park/3864.


UrbanTurf Listings showcases the DC metro area's best properties available for sale.
Most Popular... This Week • Last 30 Days • Ever

In this article, UrbanTurf looks at the estimated annual maintenance costs associated... read »
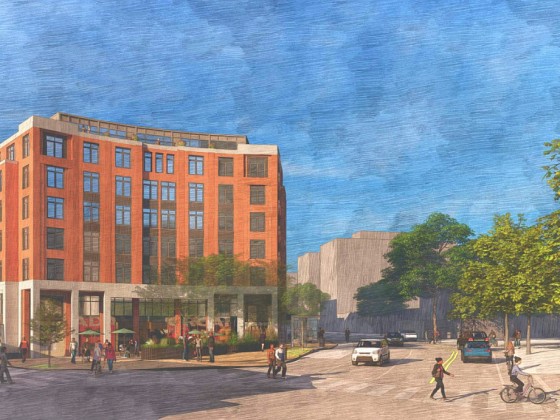
Another concept has been unveiled for one of DC's most contentious development sites,... read »

Renter demand has continued to push Class A apartment rents in the DC region up this ... read »

The big news in the development pipeline east of DC's H Street Corridor is the resur... read »
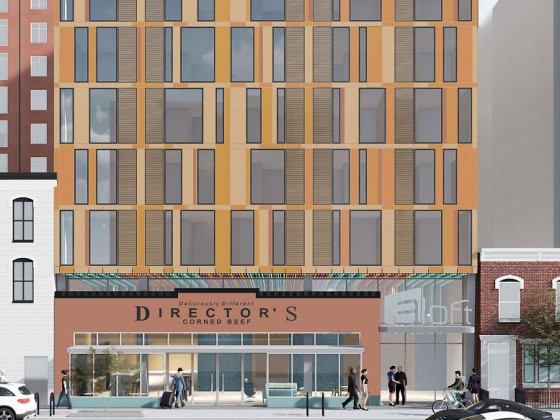
A new hotel has been pitched for a development site in Mount Vernon Triangle that has... read »


DC Real Estate Guides
Short guides to navigating the DC-area real estate market
We've collected all our helpful guides for buying, selling and renting in and around Washington, DC in one place. Start browsing below!
First-Timer Primers
Intro guides for first-time home buyers
Unique Spaces
Awesome and unusual real estate from across the DC Metro