 The Disparate Demographics of Wealth in the DC Area
✉️ Want to forward this article? Click here.
As part of an ongoing effort to track how wealth has ebbed and flowed throughout the country before and since the recent recession, the Urban Institute, Duke University & The New School recently released a report that intends to tackle the expansive topic of the “Color of Wealth in the Nation’s Capital”.
The District has had an unconventional relationship to race and wealth throughout its history, from being a slaveholding territory with small enclaves of freedmen to earning the “Chocolate City” moniker in the mid-20th century. Although the city has long boasted a thriving Black middle class, it is also no exception to historic attempts to suppress wealth-building, such as the reparations that city slaveowners were remitted after emancipation in 1862, redlining and aggressive urban renewal initiatives.
“Black people in DC have faced more than two centuries of deliberately constructed barriers to wealth building, and some of the highest barriers were embedded by design in federal law,” the report states. While the report goes into great detail about this history of demographics and structural suppression, let’s fast-forward to see some of the lingering effects noted by the study for the region.
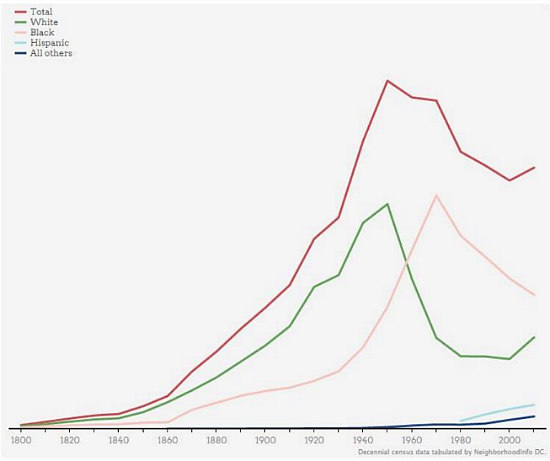
DC’s population demographics over the past 200 years
As of 2014, Blacks were still a plurality of DC’s population at 47.7 percent, while whites comprised 35.7 percent and Latinos and Asians were 10.4 and 3.7 percent respectively. Also, the region has one of the country’s largest Black middle classes and has lower rates of unemployment across all racial categories than is seen nationally. However, when it comes to the Black population, 17.1 percent are counted as unemployed compared to 2.7 percent of whites. And the disparate dynamics don’t end there. In the region, black households have only 1 percent of white households’ net worth, or assets remaining after subtracting all debts ($3,000-$3,500 compared to $284,000).
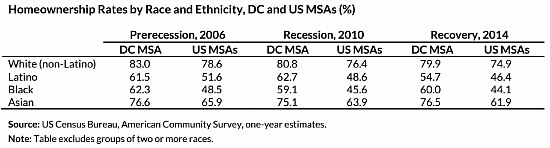
Census data on homeownership rates in the DC area from 2006-2014
While a house is often the largest asset one has, homeownership does not benefit everyone equally. The Vietnamese, Chinese and white populations in the area have the highest rates of homeownership, at 94, 90.6 and 78 percent respectively. Out of homeowner households, Chinese, Indian and Latino populations are the likeliest to carry mortgage debt.
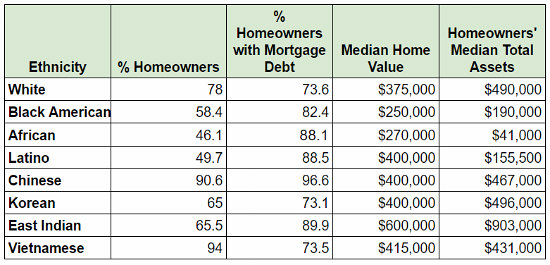
DC-area homeownership data broken down by ethnicity
The median home value of white homeowners comes in at $375,000, less than Latinos and the Asian community; Black Americans and Africans both have median home values that are less than 75 percent of that of whites.
It is fair to conclude that some minority groups were able to reap the benefits of racial progress over the years without the attendant multi-century burdens of historical discrimination. However, the study concludes that “any assertion that the racial wealth gap can be eliminated with behavioral changes on the part of Black people, rather than addressing structural racism, is fundamentally flawed.”
The report covers the Washington metropolitan area, including some portions of Alexandria and Arlington in Virginia and Frederick and Montgomery Counties in Maryland. Micro-level data was gathered using a sample of 600 phone-respondents to the 2014 National Asset Scorecard for Communities of Color survey and cross-examined with data from the Census Bureau’s American Community Survey. The administrators of the study attempted to capture a representative sample of each demographic in order to approximate the overall demographics of the area.
For the study’s purposes, “assets” include both financial and liquid assets like accounts, stocks, bonds, life insurance, etc. and tangible assets like real estate and vehicles. “Debts” include all loans and mortgages; the study also solicited data about remittances and experiences like foreclosure and payday lending.
See other articles related to: dc economy, debt, demographics, home values, homeownership, population
This article originally published at https://dc.urbanturf.com/articles/blog/the_disparate_demographics_of_wealth_in_the_dc_area/11845.


UrbanTurf Listings showcases the DC metro area's best properties available for sale.

Most Popular... This Week • Last 30 Days • Ever
The number of multi-family developments on the boards in Arlington continues to grow.... read »

With frigid weather hitting the region, these tips are important for homeowners to ke... read »

A new report from DC’s Office of Revenue Analysis highlights how millennials and wo... read »
The building is the second proposal for a pair of aging office buildings in downtown ... read »

The number of neighborhoods in DC where the median home price hit or exceeded $1 mill... read »


DC Real Estate Guides
Short guides to navigating the DC-area real estate market
We've collected all our helpful guides for buying, selling and renting in and around Washington, DC in one place. Start browsing below!
First-Timer Primers
Intro guides for first-time home buyers
Unique Spaces
Awesome and unusual real estate from across the DC Metro