What's Hot: The 4 Projects in the Works Near DC's Starburst Intersection | A 153-Room Aloft Hotel Pitched For Mt. Vernon Triangle
 The Mount Pleasant Housing Market Steps on the Gas
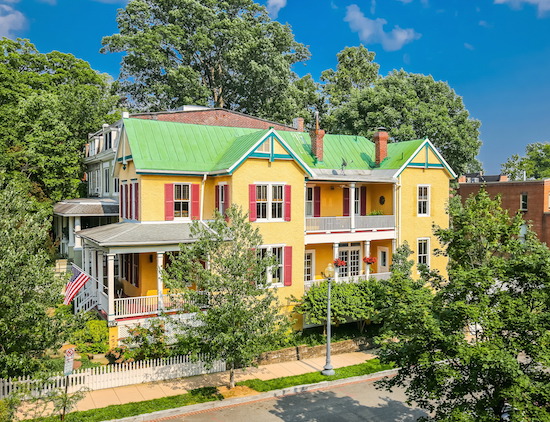
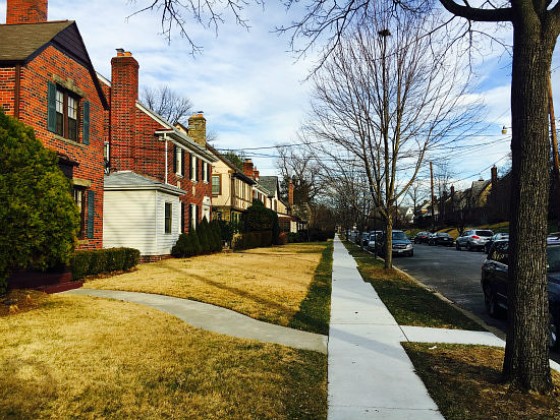
A home in Mount Pleasant.
As part of UrbanTurf’s continuing coverage of the path that DC area home prices have taken in various neighborhoods, we have shifted from an eight-year analysis to a year-to-date snapshot. This week’s edition of Home Price Watch will examine how prices in Mount Pleasant have fared this year compared to the first half of 2015.
One of the main takeaways is that homes continue to sell quickly in the northwest DC neighborhood that sits adjacent to Rock Creek Park. Homes are selling 24 percent faster than last year, with 61 percent of homes selling within ten days of being listed.
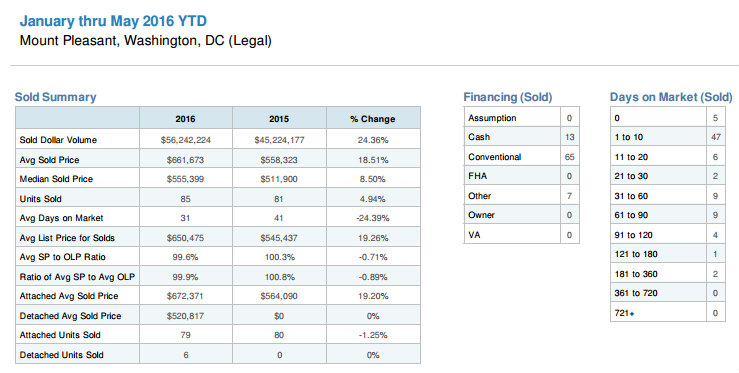
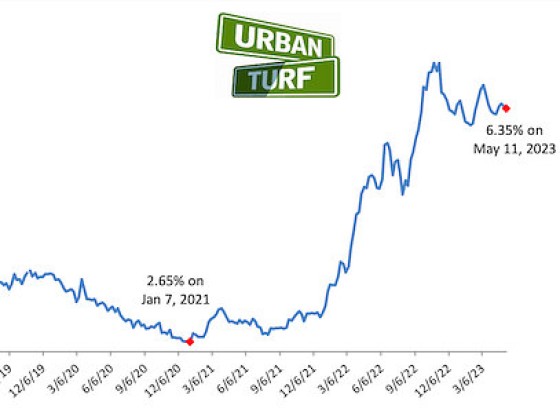
Mount Pleasant housing market statistics. Click to enlarge.
As homes have sold quicker, list prices have risen. The average listing price for a home in the neighborhood increased from $545,437 in 2015 to $650,475 in 2016, a 19 percent jump. The number of homes sold in Mount Pleasant increased five percent compared to last year, as dollar sales volume shot up 24 percent to just north of $56 million.
story continues below
loading...story continues above
All of the statistics above point to the Mount Pleasant market continuing to be competitive, along with a statistic highlighted by UrbanTurf last week: Right now, there is just a one month supply of homes on the market in the neighborhood.
Housing data for the legal subdivision of Mount Pleasant for this article was provided by RealEstate Business Intelligence.
See other articles related to: home price watch, mount pleasant, mount pleasant home prices, rbi, realestate business intelligence
This article originally published at https://dc.urbanturf.com/articles/blog/home_price_watch_25_percent_fewer_days_mt_pleasant/11426.


UrbanTurf Listings showcases the DC metro area's best properties available for sale.

Most Popular... This Week • Last 30 Days • Ever
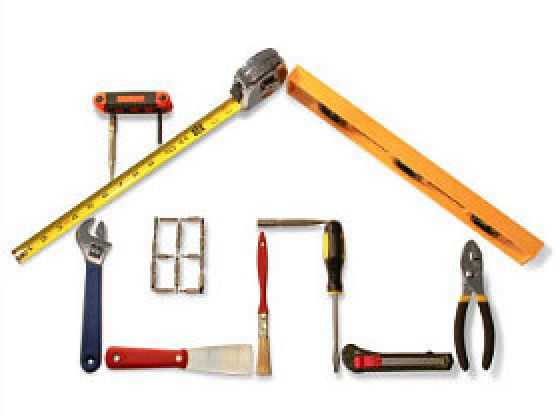
In this article, UrbanTurf looks at the estimated annual maintenance costs associated... read »
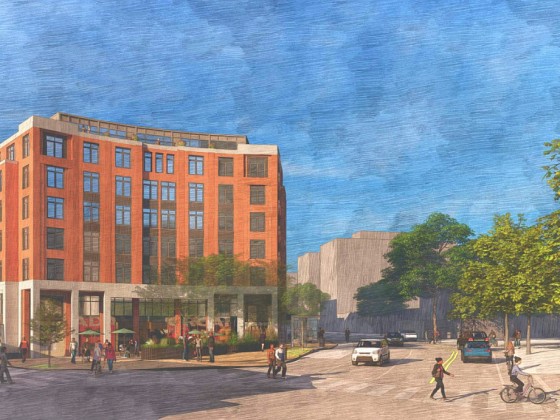
Another concept has been unveiled for one of DC's most contentious development sites,... read »

Renter demand has continued to push Class A apartment rents in the DC region up this ... read »

The big news in the development pipeline east of DC's H Street Corridor is the resur... read »
A new hotel has been pitched for a development site in Mount Vernon Triangle that has... read »


DC Real Estate Guides
Short guides to navigating the DC-area real estate market
We've collected all our helpful guides for buying, selling and renting in and around Washington, DC in one place. Start browsing below!
First-Timer Primers
Intro guides for first-time home buyers
Unique Spaces
Awesome and unusual real estate from across the DC Metro