Price-Rent Ratio Still at Bubble Levels in DC
The Center for Economic Policy Research and the National Low Income Housing Coalition have published a report that considers the affordability of housing prices with respect to rents. The so-called price-rent ratio is an important (but often overlooked) metric because it assesses real estate prices according to basic supply-demand fundamentals.
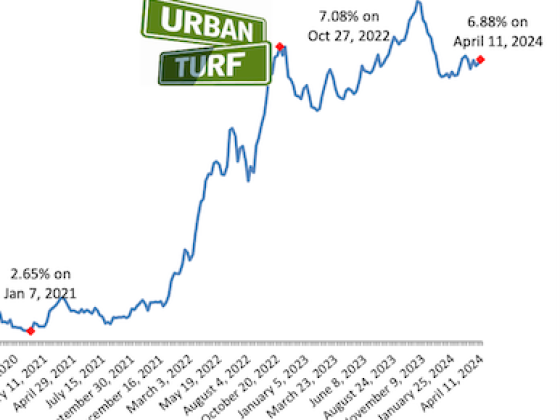
The report finds that housing prices in many markets — D.C. included — are still at bubble levels. Historically the price-rent ratio of a market in equilibrium is 15-to-1. That is, the median sales price of a home is 15 times the median annual rental income that the same home could produce. So a house that sells for $150,000 would generate $10,000 per year in income if rented out. During the peak of the bubble a couple years ago, the ratio ballooned to 25-to-1 in many markets. Anything over 18 is considered a bubble.
As of April, the price-rent ratio for the Washington, D.C. region was 21.5, putting it solidly in bubble territory. D.C wasn’t alone; 13 of the 27 biggest markets also have price-rent ratios north of 18. See the full list below:
Some market pessimists argue that real estate prices will continue to fall until the price-rent ratio is brought back in line with historic levels.
See other articles related to: renting in dc, dclofts
This article originally published at http://dc.urbanturf.com/articles/blog/price-rent_ratio_still_at_bubble_levels_in_dc/1221
Join the discussion
Most Popular... This Week • Last 30 Days • Ever

After we reported that homes in the DC area are spending a median of 11 days on the... read »
Neighborhood Profiles more »
Trinidad: The Difference 5 Years Makes
Shilpi Paul
February 15th | 27 Comments
Five years ago, the DC police department was setting up police checkpoints in the Northeast DC... read »
Editor's Choice more »
The Top 10 DC Zip Codes Where Homes Are Selling Quickest
Shilpi Paul
May 15th | 10 Comments
After we reported that homes in the DC area are spending a median of 11 days on the market, we... read »
New Condo Profiles more »
New Boutique Condo Project Coming to 17th and Q
UrbanTurf Staff
February 25th | 6 Comments
A Dupont Circle mansion is currently being converted into a four-unit condo development that will... read »
The DC Condo Market more »
18-Unit Condo Project in Adams Morgan Slated For July Delivery
Shilpi Paul
May 13th | 4 Comments
An 18-unit condo building on Champlain Street is slated for delivery in July with sales starting... read »
- 18-Unit Condo Project in Adams Morgan Slated For July Delivery
- Nine Unit Condo Project and Restaurant Coming to Bloomingdale
- New Animation Gives Size and Scope of Adams Morgan Condo Project
- A Planned 16-Unit Kalorama Condo Project Struggles With ANC
- 14th Street’s Central Union Mission Condo Project to Begin Construction in June
Green Real Estate more »
Harvest Home: DC’s Submission For the 2013 Solar Decathlon
Shilpi Paul
May 15th | 2 Comments
DC's entry into the Solar Decathalon is a net-zero home that generates energy primarily by... read »
Deal of the Week more »
Deal of the Week: U Street Condo Alternative With Rental Prospects
Shilpi Paul
March 26th | 7 Comments
While the price per square of this installment of Deal of the Week is fairly average, the lower... read »
Renting more »
14W Open For Move-ins Starting This Week
UrbanTurf Staff
April 26th | 5 Comments
14W, the 231-unit apartment building at 14th Street and W Street NW that began leasing in February,... read »
Market Watch more »
Market Watch: Logan Circle, Columbia Heights, Dupont Circle
Keith Gibbons
November 28th | 5 Comments
Housing Market Watch returns this week after a little hiatus as Keith Gibbons takes a closer look... read »
Unique Spaces more »
DC’s One-Room House
Shilpi Paul
May 2nd | 8 Comments
For those with the budget for a studio but the hankering for a house of their own, a one-room... read »
This Week's Find more »
Inspired By California in Takoma Park
Shilpi Paul
May 16th | 1 Comment
If This Week's Find looks a little out of the ordinary for Takoma Park, it's because it was... read »
UrbanTurf Reader Asks more »
UT Readers Asks: Better Than Home Depot, Less Expensive Than Georgetown?
Shilpi Paul
9:15 AM EDT | 18 Comments
In this installment of UrbanTurf Reader Asks, a DC homeowner with a fixer-upper is wondering what... read »
- UT Readers Asks: Better Than Home Depot, Less Expensive Than Georgetown?
- UT Reader Asks: Does It Make Financial Sense To Pay Down My Mortgage Faster?
- UT Reader Asks: Will New Parking Regulations Lead to More Problems?
- UT Reader Asks: Will Buyers Pay More For Old Than New?
- UT Reader Asks: Will Condo Projects Provide Discounts to Buyers Working Without Agents?
What X Buys You more »
What $760,000 Buys You in Del Ray
Shilpi Paul
May 14th | 1 Comment
In What X Buys You this week, UrbanTurf takes a look at properties on the market in the $750,000 to... read »
Best New Listings more »
Best New Listings: Grassy Yard, Pointy Roof, and Windows Galore (Week of May 10th)
Shilpi Paul
May 10th
In this week's edition of Best New Listings, UrbanTurf looks at a pointy-roofed Chevy Chase... read »
- Best New Listings: Grassy Yard, Pointy Roof, and Windows Galore (Week of May 10th)
- Best New Listings: Truxton Circle, Sears Home, Eastern Market Victorian (Week of May 3rd)
- Best New Listings: A Craftsman, A Cottage and A Co-op (Week of Apr 26th)
- Best New Listings: The DMV Edition (Week of Apr 19th)
- Best New Listings: Newly Built Modern, Forest Hills Co-op and a Rare Three-Bedroom (Week of Apr 12th)
Luxury Real Estate more »
$190 Million: The Country’s Most Expensive House
UrbanTurf Staff
May 17th | 0 Comments
A $190 million estate in Connecticut hit the market on Friday, believed to be the most expensive... read »


10 Comments
These numbers need to be taken in context. This link provides 15-year averages for different areas around the nation:
http://money.cnn.com/magazines/fortune/price_rent_ratios/
The 15-year average for “Greater Washington, D.C.” is about 15.9. However, I bet that you would get different historical averages if you compared historical averages of areas closer to DC and areas farther out. For example, some areas on the west coast, like Seattle, have 15-year averages closer to 20! (So has Seattle had a 15-year bubble? I don’t think so. It’s probably just the way the market is.)
So yes, the entire DC region *as a whole* is still “overvalued” by this metric. But does that mean every part of DC is? No. Some parts are probably still very overvalued (bringing up the average) whereas others may have corrected.
That’s the problem with averages—you don’t have an idea of why the average is the way it is. For example, is a class’s average grade on a test a C because 50% got As and 50% got Fs? Or is it because 90% got Cs?
Also, housing prices are only half of the equation here—rents also rise and fall, and those affect the ratio as well.
I agree with the comments above. My condo is appraised at around 383k and could be rented for about 2500/month give or take about $150.
At 2500/month that’s a value of about 13.
I truly feel the condo is worth a bit more but even appraised at 450 you are at a value of 15.
Not sure where that 21.5 value is coming from.
@Roots
But what about if you add condo fees to the equation (not sure how that’s supposed to fit in here)?
Steven is dead on. There’s a weird distribution here that the average is concealing. I bought my condo in Dupont for 13.69 times the rent the sellers were receiving at the time of closing and other units in my building are getting rents at about the same rate today. Asking prices in Dupont on the units I look at are more in the 17 range, but you would need a lot of places at the 25+ range to balance this out. I have no idea where that is happening.
Another good ratio is household income to price, which historically has been in the 2.1 to 2.5 range and is also higher now. True household income is hard to calculate (because usually things like gross adjusted income are reported which says more about our tax system than anything else).
I agree that overall DC is still firmly in bubble territory, and in most neighborhoods there is simply not rental/buying parity. Last year I was renting a house in a NW neighborhood for $2,800 a month, meaning it should sell for around $445,200. Similar homes are currently going for mid 500s, newly renovated for high 500s which would put it at about the 21 ratio. Right now it simply does not make financial sense for first time buyers to jump in the market, you will save money renting and can invest that capital elsewhere.
Where does the 15-1 price-to-rent ratio come from? why is more than that considered a bubble?
well just checked around and a 2BR is going for about 2350, add the 450 in condo fees and looking at 2800 (should we include D.C. taxes, that would be about 3200 total).
Appraised at 383k (which I think is pretty conservative and I don’t trust that appraisers are unaware of the selling price). Even if appraised at 400k (appraisal was without the parking space) and use the 2800 (including condo fees) then value is 14.2.
If we just consider the 2350 without condo fees and appraisal of 400k, then number is 17. I could probably easily get 2500 but being conservative.
So for a value of 21 we are talking closer to 500k. Just not seeing it, at least with my property.
Roots, a tenant wouldn’t pay condo fees or taxes on top of their rent, that would be included in the price. Without knowing the location and condition of your particular unit it is hard to comment. Also, condos historically trade below rental parity at a ratio of 10-12 because they’re generally considered a riskier investment compared to SFHs. During the housing boom there was a glut of new condo construction and conversion, and some of the new complexes ended up becoming apartments or executive suites because the units couldn’t be sold for asking price. All this overbuilding is contributing to the downward pressure on rents.
you really need to compare rents in concentric rings…
ring 1) DC + close in VA/MD
ring 2) ring 1 to the Beltway
ring 3) outside the Beltway
ring 4) way outside the Beltway (still inside the MSA)
like a stock’s P/E (Price to Earnings) ratio, some regions will run “hot” and be higher than the nationwide average. DC has lots of good jobs relative to the rest of the nation. this translates into rent paying tenants. Price-Rent goes higher the closer in to DC’s core you go. even within each ring there are differing housing micro-economies (i.e. AU Park versus Ivy City).