 Market Watch: Mount Pleasant, Columbia Heights and Petworth
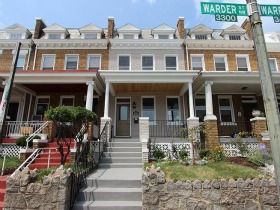
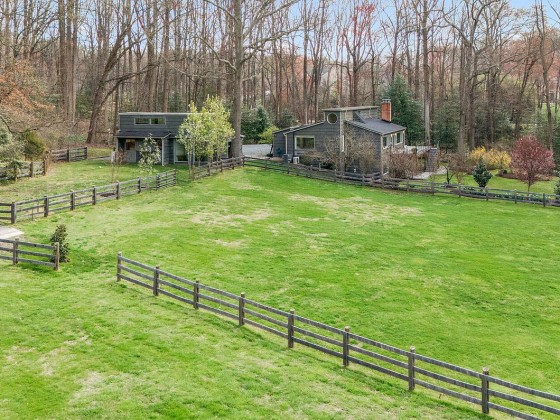
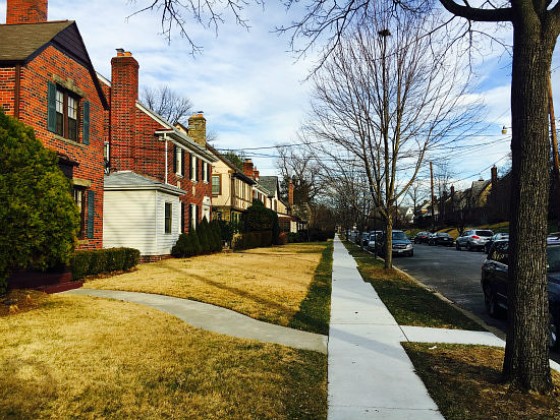
Houses on Warder Street in 20010
Housing Market Watch is a weekly feature on UrbanTurf in which Keith Gibbons, the brains behind DCHousingPrices.com analyzes recent MRIS statistics for a specific DC area zip code to help paint a picture of the housing market in that area.
In Housing Market Watch this week, UrbanTurf looks at the DC zip code 20010. From west to east, 20010 stretches from Rock Creek Park to North Capitol Street NW; on the north, it’s roughly bordered by Piney Branch Parkway/Quincy Street/Rock Creek Church Road and on the south by Irving Street and Michigan Avenue. It is home to sections of Mount Pleasant, Columbia Heights and Petworth.
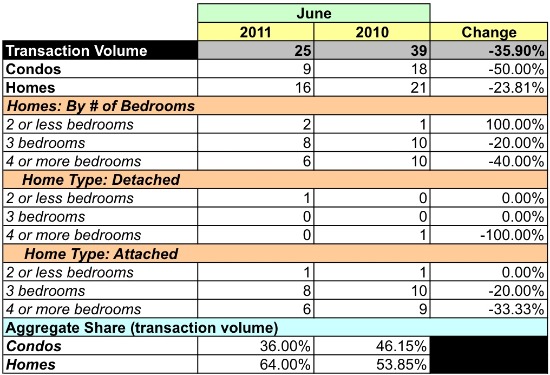
In June, 25 residential properties sold in 20010. Here is a chart providing a year-over-year comparison of sales volume, median price and average price:
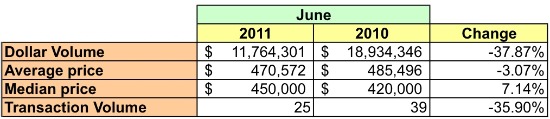
20010 Market Summary
Unit sales were down about 36 percent in the zip code when compared to the previous June, but it is important to keep in mind that the June 2010 sales numbers were particularly high thanks to the federal home buyer credit. Year over year, condo sales declined by about 50 percent, while home sales fell 24 percent; the average price for all units fell 3.07 percent, but the median price increased 7.14 percent. Single-family homes accounted for about two-thirds of the properties sold in 20010 last month, with just one foreclosure sold.
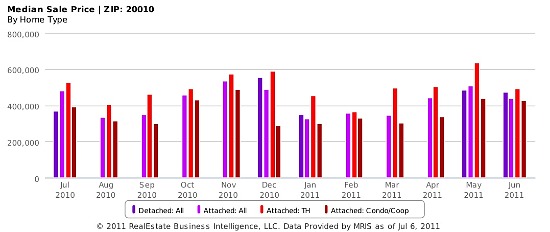
Median home sales prices in 20010 since June 2010.
There were 62 active listings in June — 42 condos and 20 houses. All but seven condos were priced below $400,000, and the houses were listed for anywhere from $100,000 to $1 million. Few detached homes have sold in 20010 during the past twelve months, which implies that buyers’ choices are limited to condos and row houses. At June’s sales pace, there’s a 4.6-months’ supply of condos and a 1.25 months’ supply of homes. With single-home inventory this low, buyers for this property type would be advised to make an offer on a place soon after seeing it as chances are that it’ll be snatched up quickly.
According to MRIS, properties in 20010 sold for 99.7 percent of their listing price in June. (I don’t think I’ve ever seen a zip code where the average selling price approached 100 percent of the list price.) Given this statistic, the zip code’s low inventory and the pricing data, it’s possible that buyers will find they have little leverage at the bargaining table in today’s pre-August 2 market.
Below are charts that provide more detailed statistics of the market in 20010.
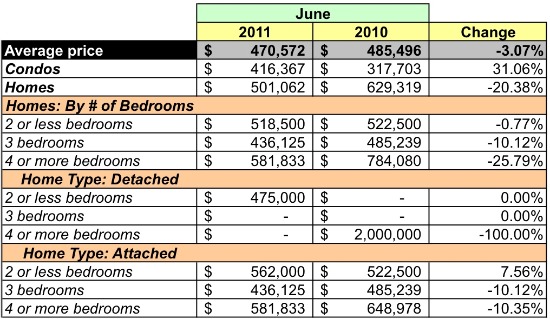
Average Sales Price
Unit Sales Volume
Similar Posts:

This article is based on custom data provided to UrbanTurf by MRIS, a developer of real estate technology and information as well as the largest multiple listing service (MLS) in the United States.
See other articles related to: columbia heights, dclofts, market watch, mount pleasant, petworth
This article originally published at https://dc.urbanturf.com/articles/blog/market_watch_mount_pleasant_columbia_heights_and_petworth/3821.


UrbanTurf Listings showcases the DC metro area's best properties available for sale.

Most Popular... This Week • Last 30 Days • Ever

DC's homebuyer assistance programs can be a bit complex. This edition of First-Timer ... read »

In this article, UrbanTurf looks at the estimated annual maintenance costs associated... read »

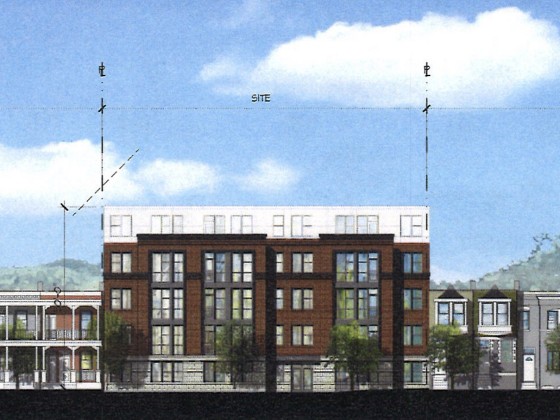
Plans for the development at a prominent DC intersection began nearly eight years ago... read »
Today, UrbanTurf is examining one of our favorite metrics regarding competition in th... read »
The residential development in the works along Florida Avenue NE is looking to increa... read »


- First-Timer Primer: DC's Home Buyer Assistance Programs
- What Are the Annual Maintenance Costs When You Own a Home?
- 388-Unit Development At Site of North Capitol Street Exxon Nears Completion
- The 6 Places In The DC Area Where You Aren't The Only One Bidding On a Home
- 46 to 48: The Biggest Project In Trinidad Looks To Get Bigger
DC Real Estate Guides
Short guides to navigating the DC-area real estate market
We've collected all our helpful guides for buying, selling and renting in and around Washington, DC in one place. Start browsing below!
First-Timer Primers
Intro guides for first-time home buyers
Unique Spaces
Awesome and unusual real estate from across the DC Metro