 Market Watch: 20018 -- Low Sales Volume in Far Northeast DC
Housing Market Watch is a weekly feature on UrbanTurf in which Keith Gibbons, the brains behind DCHousingPrices.com, analyzes recent MRIS statistics for a specific DC-area zip code to help paint a picture of the housing market in that area.
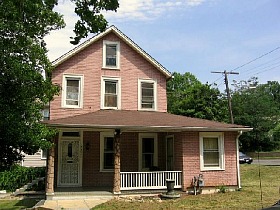
In Housing Market Watch this week, UrbanTurf looks at May’s closed sales for the zip code of 20018 in Northeast DC. The area covered by 20018 is bounded by the Maryland line on the east, New York Avenue NE on the south, and Michigan Ave NE, 17th Street NE, 16th Street NE, and the rail tracks by the Rhode Island Metro station on the west. 20018 is home to the Brentwood, Langdon, Port Lincoln, and eastern Brookland neighborhoods.
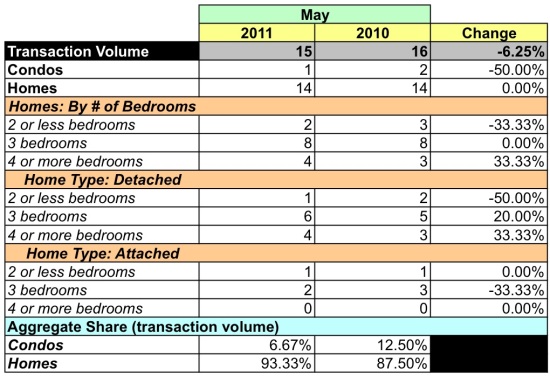
In May, 15 residential properties sold in 20018. Here is a chart providing a year-over-year comparison of sales volume, median price and average price:
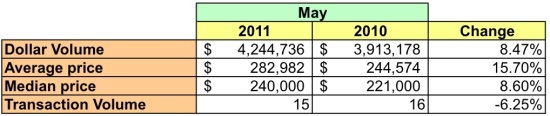
20018 Market Summary
Here are some key points to note about 20018:
- Aggregate dollar volume was up 8.47 percent over the same month in 2010. Unit sales fell 6.25 percent. The average price for a home rose 15.7 percent and the median price was up 8.6 percent.
- Two of the units sold were bank-mediated sales.
- The median price for the bank-mediated sales was $192,500.
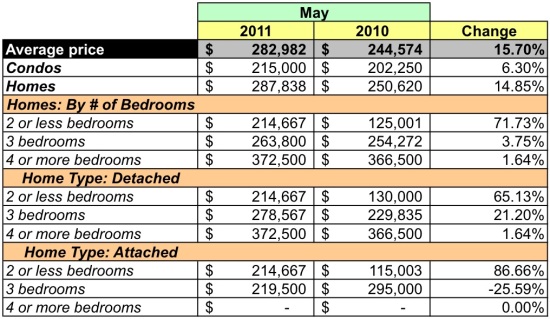
- One condo sold for $215K.
- The average price for a house was $287,838. No house sold for more than $600K.
20018 represents 1.31 percent of May’s aggregate dollar volume across the District and 2.43 percent of the total units sold. Its average price is 46.28 percent lower than the District’s total average, and its median price is 39.85 percent lower. At May’s sales rate there’s an 8-month supply of condos and a 3.85-month supply of houses in 20018.
There were only 8 active condo listings during May, all priced lower than $300K. Of the 54 houses with active listings, the attached houses top out at $500K and 30 of the 38 listed detached houses are priced below $400K. According to MRIS, properties in 20018 sold for 87 percent of the listing price. Looking forward, 18 homes went under contract in May and another 9 had contingent sale contracts.
The data show that detached and attached houses dominate the market in 20018; few condos have been sold during the past twelve months. The average price for a house with 3 or more bedrooms has been less than $480K for the past twelve months.
Below are charts that provide more detailed statistics of the market in 20018.
Average Sales Price in 20018
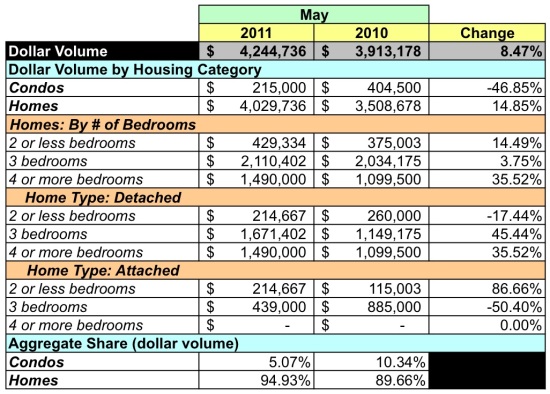
Dollar Volume in 20018
Unit Sales Volume in 20018
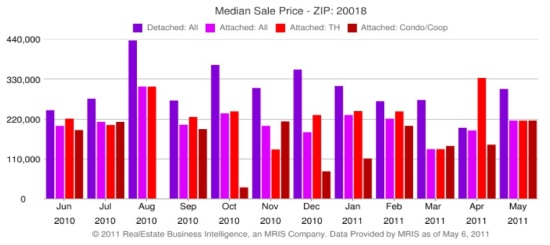
Median Sales Price in 20018
Related Posts:
- Market Watch: 20743 — Laden With Foreclosures
- Market Watch 20012: Typically Not A Lot of Action
- Brookland: New Development Could Shake Up Pastoral Peace

This article is based on custom data provided to UrbanTurf by MRIS, a developer of real estate technology and information as well as the largest multiple listing service (MLS) in the United States.
See other articles related to: 20018, brentwood, dclofts, langdon, market watch, port lincoln
This article originally published at https://dc.urbanturf.com/articles/blog/market_watch_20018_--_low_sales_volume_in_far_northeast_dc/3756.


UrbanTurf Listings showcases the DC metro area's best properties available for sale.

Most Popular... This Week • Last 30 Days • Ever

The big news in the development pipeline east of DC's H Street Corridor is the resur... read »

In this article, UrbanTurf looks at the estimated annual maintenance costs associated... read »

Today, UrbanTurf is examining one of our favorite metrics regarding competition in th... read »
Another concept has been unveiled for one of DC's most contentious development sites,... read »
The residential development in the works along Florida Avenue NE is looking to increa... read »


- The 4 Projects In The Works Near DC's Starburst Intersection
- What Are the Annual Maintenance Costs When You Own a Home?
- The 6 Places In The DC Area Where You Aren't The Only One Bidding On a Home
- A First Look At The New Plans For Adams Morgan's SunTrust Plaza
- 46 to 48: The Biggest Project In Trinidad Looks To Get Bigger
DC Real Estate Guides
Short guides to navigating the DC-area real estate market
We've collected all our helpful guides for buying, selling and renting in and around Washington, DC in one place. Start browsing below!
First-Timer Primers
Intro guides for first-time home buyers
Unique Spaces
Awesome and unusual real estate from across the DC Metro