 How DC Housing Has Changed Since 2008
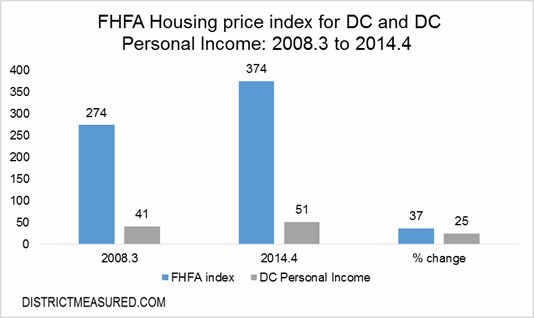
Housing prices compared to income.
In a new post to its blog District Measured, the Office of Revenue Analysis looked at how the city’s economy has changed since 2008 and where things stand now in the wake of the recession. The post — drawn from a variety of public data sources — points to two trends in DC’s housing market that have significantly shifted over the last six years.
One is prices: Housing prices, the post notes, have increased faster than incomes in DC over the last seven years. The value of single-family housing units went up by 37 percent as incomes rose 25 percent.
The other relates to housing units. The District added more new households, as defined by the Census, than housing units. (The Census uses “household” to mean occupied housing unit.) Households jumped by 29,000 between 2008 and 2014, but new housing permits increased at a smaller rate. To compare, District Measured came up with two different figures for the number of new units: new housing permits (12,483) and the combined number of new condo units sold, permits for projects of one to four units and increased occupancy in larger, market-rate rental apartment buildings (14,372).
Either way, the post suggests housing permit data doesn’t capture the number of units that have been added in the city: “Population increase .. seems likely to have been accompanied by significant adjustment to and renovation of the DC housing stock beyond what is captured in the housing permit data,” District Measured concludes.
See other articles related to: dc economy, district measured
This article originally published at https://dc.urbanturf.com/articles/blog/how_dc_housing_has_changed_since_2008/9791.
Most Popular... This Week • Last 30 Days • Ever

The big news in the development pipeline east of DC's H Street Corridor is the resur... read »

In this article, UrbanTurf looks at the estimated annual maintenance costs associated... read »
Today, UrbanTurf is examining one of our favorite metrics regarding competition in th... read »
Another concept has been unveiled for one of DC's most contentious development sites,... read »
The residential development in the works along Florida Avenue NE is looking to increa... read »
- The 4 Projects In The Works Near DC's Starburst Intersection
- What Are the Annual Maintenance Costs When You Own a Home?
- The 6 Places In The DC Area Where You Aren't The Only One Bidding On a Home
- A First Look At The New Plans For Adams Morgan's SunTrust Plaza
- 46 to 48: The Biggest Project In Trinidad Looks To Get Bigger
DC Real Estate Guides
Short guides to navigating the DC-area real estate market
We've collected all our helpful guides for buying, selling and renting in and around Washington, DC in one place. Start browsing below!
First-Timer Primers
Intro guides for first-time home buyers
Unique Spaces
Awesome and unusual real estate from across the DC Metro


