 Housing Market Watch: 20015
Housing Market Watch is a weekly feature on UrbanTurf in which Keith Gibbons, the brains behind DCHousingPrices.com analyzes recent MRIS statistics for a specific DC zip code to help paint a picture of the housing market in that area.
In Housing Market Watch this week, UrbanTurf takes a look at home sales statistics for the 20015 zip code.
20015 is roughly bordered by Western Avenue NW on the west; Harrison Street, Nevada Avenue, and Broad Branch Road on the south; Beach Drive and Rock Creek Park on the east; and Beach Drive on the north. Portions of neighborhoods including Friendship Heights, Barnaby Woods, and Chevy Chase DC are encompassed within those borders. It is a zip code where it is not uncommon to see deer from Rock Creek Park munching on shrubbery.
Fourteen units sold in 20015 in January and here is a chart providing a year-over-year comparison of sales volume, median price and average price:
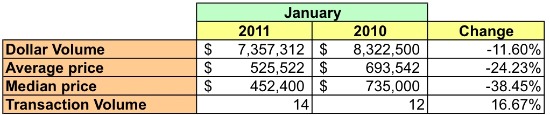
20015 Market Summary
- Compared to January 2010, aggregate dollar volume fell 11.6 percent in 20015, but the number of units sold increased 16.67 percent. This difference can be explained by the fact that condos ruled 20015’s housing market in January, accounting for 10 of the 14 units sold; the number of condos sold in January 2011 was more than double that of January 2010.
- In January, 20015 represented 3.67 percent of unit sales in DC, and in comparison to the rest of the city, the average median price was 19.2 percent higher.
- Since 2007, with the exception of January 2008, about 14 homes have sold each January in 20015. However, 20015’s overall market activity in January 2011 [contracts closed, homes under contract, homes with contingent contracts] was at its highest level since January 2007.
- A few other interesting takeaways: 1) No property sold for over $1 million and 2) Eight of the ten condos sold for between $300,000 and $499,000
The difference in the types of homes that sold this past January versus January 2010 explain many of the metrics (lower dollar volume, lower average sales price, lower median price) for January 2011. About two-thirds of sales in January 2010 were single-family homes while lower priced condos represented 71 percent of units sold in January 2011. If new listings are any indication, that trend is about to change. Of the 33 listings that came on the market in January, 22 were single-family homes and of those, ten were listed for between $1 million and $2.49 million.
At January’s sales pace, there is slightly more than a month’s supply of condos and a 5.5-months supply of single-family homes listed in 20015, making it what some would call a seller’s market. To reinforce that point, MRIS records that the sales in January were at 99.94 percent of list price, so homes were selling at (or just slightly below) the asking price.
Based on January data, 20015 is a zip code where homes are selling at list and inventory is tight. For those who want to purchase a home in this area, be prepared to move fast and to offer full price (or more).
Below are charts that provide more detailed statistics of the market in 20015.
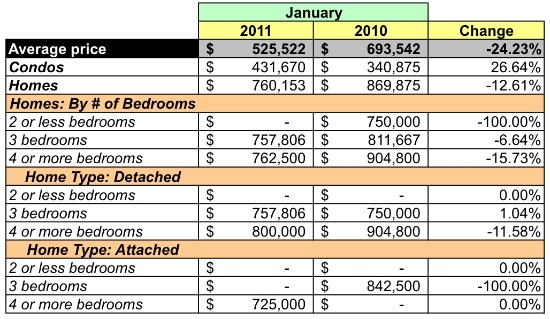
Average Price
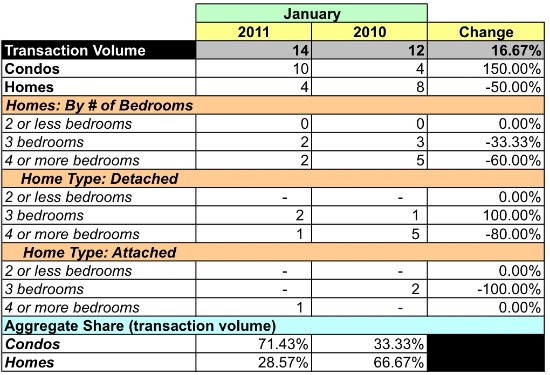
Unit Sales Volume
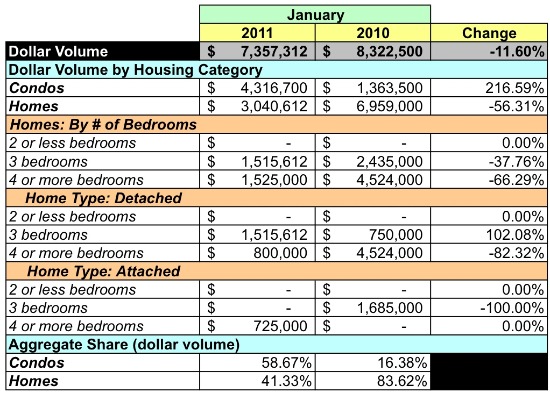
Dollar Volume
Next Week: We head out to Northern Virginia for a report on the 22314 zip code.
Similar Posts:
See other articles related to: 20015, barnaby woods, chevy chase, dclofts, friendship heights, market watch
This article originally published at https://dc.urbanturf.com/articles/blog/housing_market_watch_20015/3108.


UrbanTurf Listings showcases the DC metro area's best properties available for sale.

Most Popular... This Week • Last 30 Days • Ever

Grain Wood Furniture offers solid wood furniture that delivers timeless appeal to eve... read »

DC's homebuyer assistance programs can be a bit complex. This edition of First-Timer ... read »

In this article, UrbanTurf looks at the estimated annual maintenance costs associated... read »

Plans for the development at a prominent DC intersection began nearly eight years ago... read »
Today, UrbanTurf is examining one of our favorite metrics regarding competition in th... read »


- Grain Wood Furniture: The Virginia-Based IKEA Alternative
- First-Timer Primer: DC's Home Buyer Assistance Programs
- What Are the Annual Maintenance Costs When You Own a Home?
- 388-Unit Development At Site of North Capitol Street Exxon Nears Completion
- The 6 Places In The DC Area Where You Aren't The Only One Bidding On a Home
DC Real Estate Guides
Short guides to navigating the DC-area real estate market
We've collected all our helpful guides for buying, selling and renting in and around Washington, DC in one place. Start browsing below!
First-Timer Primers
Intro guides for first-time home buyers
Unique Spaces
Awesome and unusual real estate from across the DC Metro