 Housing Market Watch: 20003
UrbanTurf is proud to welcome a new contributor to the site this week — Keith Gibbons. Some readers may recognize Keith’s name as he is the brains behind DCHousingPrices.com. Every other week, Keith will be analyzing recent MRIS statistics for a DC zip code to help paint a picture of the housing market in that area.
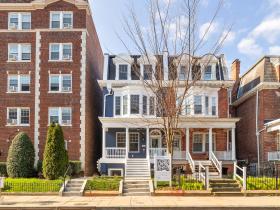
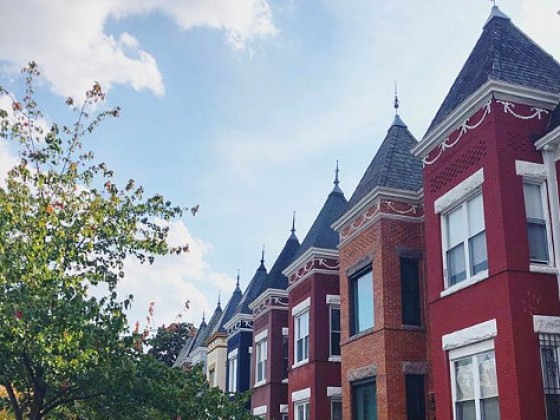
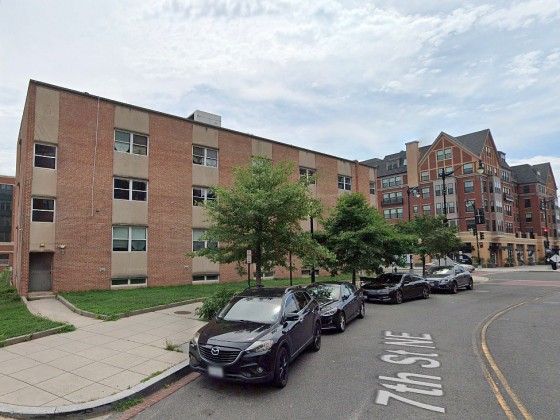
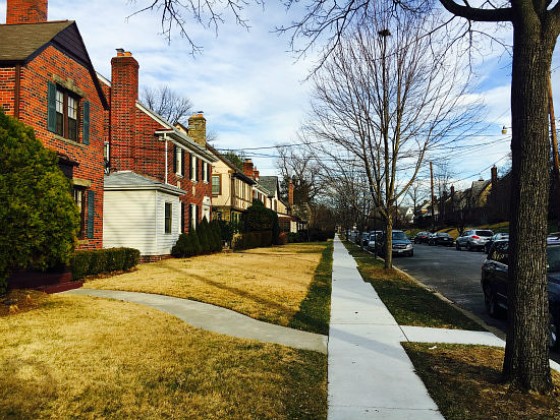
In Housing Market Watch this week, UrbanTurf analyzes recently-released home sales statistics for the 20003 zip code. Roughly speaking, that zip code is bordered on the north by East Capitol Street, on the west by South Capitol Street, and to the south and east by the Anacostia River. It includes portions of Capitol Hill, Hill East, and the Navy Yard neighborhoods.
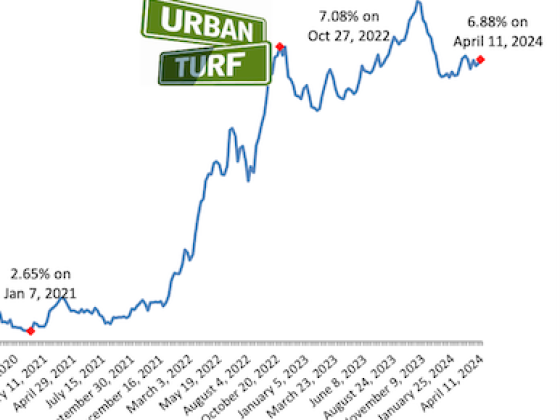
Only 18 units sold in 20003 in January, so the data set is not very statistically significant. However, here is a chart providing a year-over-year comparison of sales volume, median price and average price:

20003 Market Summary
- Year over year, aggregate dollar volume fell 25.72 percent and the number of units sold dropped 35.71 percent.
- Despite the dearth of sales, average prices were up. Condo prices increased 40.17 percent and home prices were up 5.84 percent (more details below). No condo sold for more than $800,000 and no home sold for over $1 million.
- Condo sales volume was down 55.56 percent. Home sales volume was down 26.32 percent.
20003 represented 4.72 percent of total unit sales in the District in January. However, in comparison to the rest of the city, the median price of homes sold in the zip code was 29.71 percent higher. At January’s sales pace (a typically slow month for home sales) there is a 10.75 months supply of condos in 20003 and a 4.71 months supply for houses. The latter stat is great if you’re trying to sell a house, but makes for slim pickings if you are trying to buy one.
Below are charts that provide more detailed statistics of the market in 20003.
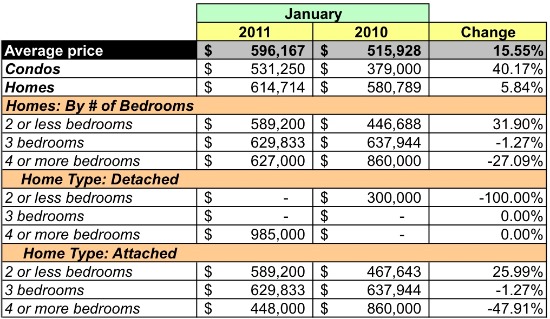
Average Price
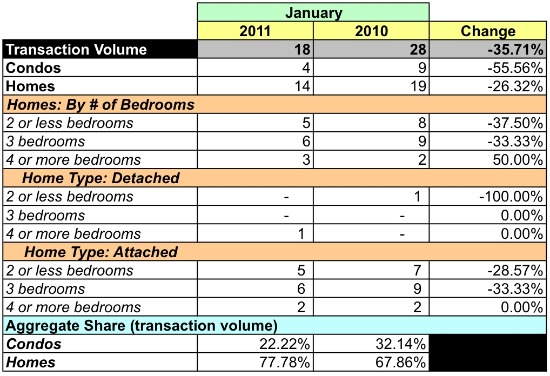
Unit Sales Volume
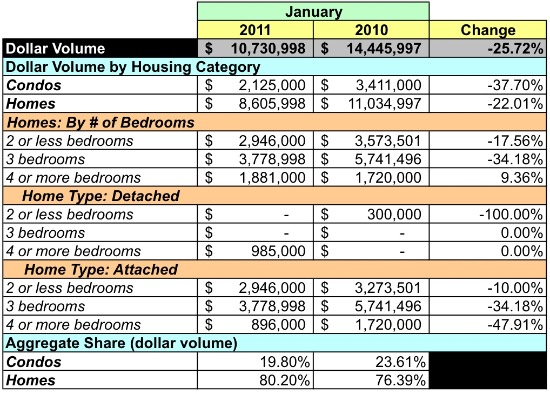
Dollar Volume
See other articles related to: capitol hill, dclofts, hill east, market watch
This article originally published at https://dc.urbanturf.com/articles/blog/housing_market_watch_20003/2990.


Play to hear Jen in her own words


UrbanTurf Listings showcases the DC metro area's best properties available for sale.
Most Popular... This Week • Last 30 Days • Ever

DC's homebuyer assistance programs can be a bit complex. This edition of First-Timer ... read »
When it comes to financing a home purchase, a 30-year mortgage is one of the most com... read »
Pocket listings are growing in popularity in the low-inventory market in the DC regio... read »

Margarite is a luxury 260-apartment property known for offering rich, high-end reside... read »
The owner of 700 Monroe Street NE filed a map amendment application with DC's Zoning ... read »


DC Real Estate Guides
Short guides to navigating the DC-area real estate market
We've collected all our helpful guides for buying, selling and renting in and around Washington, DC in one place. Start browsing below!
First-Timer Primers
Intro guides for first-time home buyers
Unique Spaces
Awesome and unusual real estate from across the DC Metro