 DC's Racial Divide, Circa 2000
DCist has featured a fascinating map of the ethnic breakdown of the DC metropolitan area, based on data from the 2000 Census. The colored dots on the map below, created by Eric Fischer, correspond to 25-person groups of specific ethnicities (red represents White, blue represents Black, green represents Asian, orange represents Hispanic).
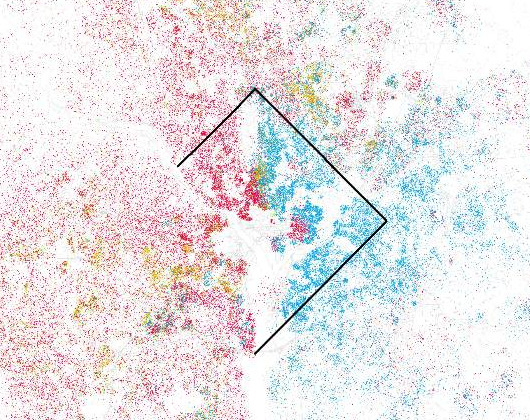
The racial divide illustrated by the map is extremely noticeable, with red dots dominating much of Northwest and blue dots filling Northeast and Wards 7 and 8. The white section near the top of the map that is Rock Creek Park shows how much of a dividing line the park was between white and black communities in 2000. Also, it is interesting to get a bird’s eye view of Capitol Hill (that little pocket of red toward the lower right corner of the map).
Hopefully Fischer will create similar maps once the 2010 Census data is released, as it will be interesting to see how things have changed during the past ten years.
This article originally published at https://dc.urbanturf.com/articles/blog/dcs_racial_divide_circa_2000/2492.


UrbanTurf Listings showcases the DC metro area's best properties available for sale.

Most Popular... This Week • Last 30 Days • Ever

Grain Wood Furniture offers solid wood furniture that delivers timeless appeal to eve... read »

DC's homebuyer assistance programs can be a bit complex. This edition of First-Timer ... read »

In this article, UrbanTurf looks at the estimated annual maintenance costs associated... read »

Plans for the development at a prominent DC intersection began nearly eight years ago... read »

Today, UrbanTurf is examining one of our favorite metrics regarding competition in th... read »


- Grain Wood Furniture: The Virginia-Based IKEA Alternative
- First-Timer Primer: DC's Home Buyer Assistance Programs
- What Are the Annual Maintenance Costs When You Own a Home?
- 388-Unit Development At Site of North Capitol Street Exxon Nears Completion
- The 6 Places In The DC Area Where You Aren't The Only One Bidding On a Home
DC Real Estate Guides
Short guides to navigating the DC-area real estate market
We've collected all our helpful guides for buying, selling and renting in and around Washington, DC in one place. Start browsing below!
First-Timer Primers
Intro guides for first-time home buyers
Unique Spaces
Awesome and unusual real estate from across the DC Metro