DC Metro Area Real Estate Market: A Quick Update
Donna Evers, president of Evers & Co. Real Estate, pens a brief monthly report on the state of the housing market in the Washington, DC area. Below is the latest installment for July.

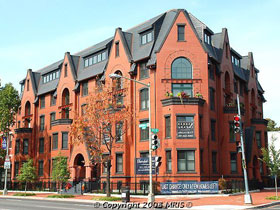
Butterfield House in Capitol Hill
July was the second month in a row to show an increase in dollar volume of sales; June was 4% higher than last year, while July was 8% higher. This is certainly starting to look like a trend. As for inventory, the area has a mere 4.9 month’s supply so far this year compared to 7.2 month’s supply for 2008.
The third trend that bears noting is price. The average price for all of last year only went down 4%, but the average price for this year so far has declined 14%. This part of the puzzle may not seem to fit, but prices only come down well after there is reduction in sales volume. Of the three areas in our study, Fairfax County, which has had the greatest price reductions in recent years, is now showing the lowest month’s supply and less decline in prices than the other areas. The District shows the sharpest price reductions and has the highest inventory, and Montgomery County is in the middle.
If the economy continues to improve, we should see all three areas picking up in sales. Fairfax County may be the first to show a gain in prices from the previous year, and it looks like the District of Columbia and Montgomery County may still have to go through further price reductions. All the areas continue to show an oversupply of product in upper brackets properties, with the cheapest homes and condos selling the fastest.
* Statistics are taken from the Metropolitan Regional Information System for three areas: Washington, D.C.; Montgomery Country, Maryland; and Fairfax County, Arlington, Alexandria and Falls Church.
See other articles related to: dclofts
This article originally published at http://dc.urbanturf.com/articles/blog/dc_metro_area_real_estate_market_a_quick_update/1247
Join the discussion
Most Popular... This Week • Last 30 Days • Ever

The Mint, a new 21-unit condo project from PERS Development at 4th Street and Rhode... read »
Neighborhood Profiles more »
Kalorama: A Posh View From Embassy Row
Shilpi Paul
May 11th | 4 Comments
The small neighborhood of Kalorama emerged during a period of rapid development in DC's history,... read »
Editor's Choice more »
DC Area Home Prices Rise 11.2 Percent
Shilpi Paul
May 10th | 7 Comments
DC area home prices rose 11.2 percent in April, the largest increase for prices in almost six... read »
New Condo Profiles more »
New Boutique Condo Project Hits the Market in Columbia Heights
UrbanTurf Staff
April 24th | 1 Comment
A new 5-unit condo project hit the market in Columbia Heights today from the same developer that... read »
The DC Condo Market more »
Abdo Returns to Logan With 30-Unit Project
UrbanTurf Staff
May 2nd | 8 Comments
Developer Jim Abdo made his name in Logan Circle, and is now returning to the neighborhood with a... read »
Green Real Estate more »
Should DC Follow LA in Teaching Residents How to Green Their Homes?
Shilpi Paul
May 7th | 2 Comments
While LEED certification is quickly becoming standard for new buildings in DC, residents in the... read »
Deal of the Week more »
Deal of the Week: Georgetown on the Cheap
UrbanTurf Staff
May 8th | 1 Comment
Georgetown is known for a lot of things, but reasonably priced homes for the mere mortal is not one... read »
Renting more »
Testing the Waters: How Much For a Columbia Heights Row House?
UrbanTurf Staff
May 9th | 7 Comments
A reader who wants to rent his three-bedroom row house in Columbia Heights recently wrote in to... read »
Market Watch more »
Market Watch: Logan Circle, Columbia Heights, Dupont Circle
Keith Gibbons
November 28th | 5 Comments
Housing Market Watch returns this week after a little hiatus as Keith Gibbons takes a closer look... read »
Unique Spaces more »
This Week’s Find: From Pie to Hooch to Heroin to Home
Shilpi Paul
March 28th | 7 Comments
Built in 1860, This Week's Find has a past that includes life as a pie factory and clearing house... read »
This Week's Find more »
A 33-Foot Wide Living Room in Kalorama
Shilpi Paul
May 17th | 1 Comment
In This Week's Find, we take a look at a home whose layout reaches into the house next door. ... read »
UrbanTurf Reader Asks more »
Do I Deserve Financial Compensation?
UrbanTurf Staff
May 7th | 11 Comments
In this installment of UrbanTurf Reader Asks, a reader who recently moved into a rental building in... read »
What X Buys You more »
What $330,000 Buys You in DC
Shilpi Paul
May 16th | 6 Comments
In What X Buys You this week, UrbanTurf takes a look at properties on the market in the $325,000 to... read »
Best New Listings more »
Best New Listings: A Tudor, A Co-op and Chocolate Mint in the Garden (Week of May 18th)
Shilpi Paul
May 18th | 0 Comments
In this week's edition of Best New Listings, we look at a Tudor tucked away off 16th Street, a... read »
- Best New Listings: A Tudor, A Co-op and Chocolate Mint in the Garden (Week of May 18th)
- Best New Listings: Georgetown, Kent and Logan Circle (Week of May 11th)
- Best New Listings: Deceptive Facade, High Tech Renovations and a Beautiful Backyard (Week of May 4th)
- Best New Listings: Dupont Dog Owner, The Turret House, 1927 Craftsman (Week of Apr 27th)
- Best New Listings: Petworth Wardman, Carly Simon Condo and a Light-Filled Row House (Week of Apr 20th)
Luxury Real Estate more »
The Priciest and Largest Plot of Land in DC Hits the Market
UrbanTurf Staff
May 18th | 2 Comments
UrbanTurf has learned that a 1.25 acre plot of land has hit the market in Cleveland Park, making it... read »


1 Comment
I know that agents are probably a little more interested in volume than price. I think the volume data is relatively easy to understand.
Unfortunately the price data is not what it seems. Average price is unlikely to reveal price trends because the mix of housing is also changing. The Case/Shiller index indicates that price changes in each of three tiers in the DC metro area are not synchronized, they don’t even go in the same direction.
So if MRIS reports an increase in average price, it might be caused by a change in the mix of sales and not a change in the underlying value of the homes sold.
For example, say that in May three houses sell: two for a million and one for a hundred thousand. Average price is $700,000. In June three more houses sell: one for a million and two for one hundred thousand. Average price is now $400,000 for a 43% month over month decline in average price.
Obviously this change in average price is meaningless if you are interested in understanding how the market values real estate.
There are a lot of things that cause changes in sales mix other than simple consumer preference. One example is when there’s a change in the pricing difference between a prime and a jumbo loan.